

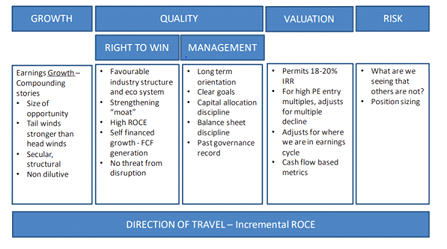
The objective is to invest in compounding stories (companies with tail winds of growth that are focused on disciplined growth around a core business definition, and where success is reflected in an expanding moat and increasing market share and ROE).

| Alpha (1Y) | Beta (1Y) | Standard Deviation (1Y) | % of +ve Months (SI) |
|---|---|---|---|
| 12.73% | 1.20 | 23.06% | 66.12% |
Investment Philosophy
• We seek secular compounding at a reasonable price
• Strong process orientation that uses frameworks for company evaluation, ascertaining fair valuation, portfolio construction and risk management.
Performance Table #
| Trailing Returns (%) | 1m return | 3m return | 6m return | 1y return | 2y return | 3y return | 5y return | 10y return | Since inception return |
|---|---|---|---|---|---|---|---|---|---|
| Solidarity Advisors Pvt Ltd Prudence | 7.01% | 34.13% | 22.18% | 17.92% | 15.42% | 15.90% | 12.47% | 17.41% | 17.78% |
| S&P BSE 500 TRI | 1.73% | 12.10% | -3.53% | -1.96% | 1.52% | 12.53% | 12.21% | 13.92% | 14.36% |
QRC Report Card *
| Strategy | Category | Fund Manager | Date of Inception | Age Of PMS | Corpus (in Cr, approx) | Benchmark | Returns SI (CAGR) | Stocks In Portfolio | Sectors In Portfolio |
|---|---|---|---|---|---|---|---|---|---|
| Solidarity Advisors Pvt Ltd Prudence | Multi Cap & Flexi Cap | Mr Manish Gupta | 11 May 2016 | 10Y 2M | 1750.54 | S&P BSE 500 TRI | 17.78% | - | NA |
| Portfolio Quality (Q) | Portfolio Risk (R) | Portfolio Consistency (C) | ||||||||
|---|---|---|---|---|---|---|---|---|---|---|
| Index | Category Alpha (1Y) | Relative Alpha (1Y) |
% of +ve Months
(Fund Data) |
Alpha (1Y) | Beta (1Y) |
Standard Deviation (1Y)
(Fund Data) |
Sharpe Ratio (1Y)
(Fund Data) |
Alpha (SI) | Information Ratio (SI) | Consistency Ratio % |
| Nifty 50 | 6.94% | 10.01% | 66.12% | 16.95% | 1.20 | 23.06% | 0.37 | 5.73% | 0.48 | 51.24 % |
| Nifty 500 | 3.35% | 9.38% | 12.73% | 1.20 | 4.12% | 0.41 | 53.72 % | |||
| Nifty Midcap 100 | -4.07% | 8.66% | 4.59% | 1.06 | 0.31% | 0.03 | 50.41 % | |||
| Nifty Smallcap 100 | 2.35% | 8.31% | 10.66% | 0.82 | 3.64% | 0.28 | 49.59 % | |||
| BSE 500 | 3.81% | 9.39% | 13.20% | 1.21 | 4.26% | 0.42 | 53.72 % | |||
VIEW DETAILED QUALITY, RISK, CONSISTENCY ANALYSIS
Portfolio Holdings
| Holding | % |
|---|
Sector Allocation
| Holding | % |
|---|
Market Cap Allocation
| Allocations | % |
|---|---|
| Large Cap | |
| Mid Cap | |
| Small Cap | |
| Cash |
Do Not Simply Invest, Make Informed Decisions
WISH TO MAKE INFORMED INVESTMENTS FOR LONG TERM WEALTH CREATION
Disclaimer
#Returns as of 30th Jun 2026. Returns up to 1 Year are absolute, above 1 Year are CAGR.
*QRC Report Card data is updated quarterly. Current data is as of May 26.

