

To generate capital appreciation by investing in companies available at reasonable valuations.
| Alpha (1Y) | Beta (1Y) | Standard Deviation (1Y) | % of +ve Months (SI) |
|---|---|---|---|
| -4.72% | 0.84 | 14.46% | 58.49% |
More about Investment Philosophy
Portfolio of attractively valued companies benefiting from demand recovery in cyclical and consumer discretionary sectors.
• D – Demand recovery across cyclical & consumer discretionary sectors
• A – Attractive valuation to provide margin of safety
• W – Winning companies on the cusp of a new demand cycle leading to operating W & financial leverage efficiencies
• N – New credit & investment cycle to provide a boost to earnings recovery
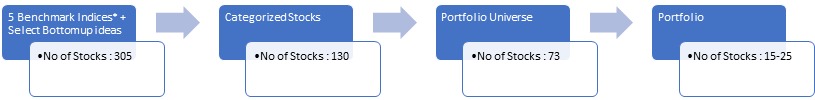
Process Driven Stock Selection Approach

Wish to make INFORMED INVESTMENTS for Long Term WEALTH CREATION
Do Not Simply Invest, Make Informed Decisions
Performance Table #
| Trailing Returns (%) | 1m return | 3m return | 6m return | 1y return | 2y return | 3y return | 5y return | 10y return | Since inception return |
|---|---|---|---|---|---|---|---|---|---|
| Invesco Asset Management (I) Pvt Ltd DAWN | 2.47% | 8.94% | -6.02% | -6.78% | -4.82% | 8.76% | 11.27% | - | 8.89% |
| S&P BSE 500 TRI | 1.73% | 12.10% | -3.53% | -1.96% | 1.52% | 12.53% | 12.21% | - | 12.95% |
QRC Report Card *
| Strategy | Category | Fund Manager | Date of Inception | Age Of PMS | Corpus (in Cr, approx) | Benchmark | Returns SI (CAGR) | Stocks In Portfolio | Sectors In Portfolio |
|---|---|---|---|---|---|---|---|---|---|
| Invesco Asset Management (I) Pvt Ltd DAWN | Thematic | Mr. Neelesh Dhamnaskar | 28 August 2017 | 8Y 10M | 217.53 | S&P BSE 500 TRI | 8.89% | - | NA |
| Portfolio Quality (Q) | Portfolio Risk (R) | Portfolio Consistency (C) | ||||||||
|---|---|---|---|---|---|---|---|---|---|---|
| Index | Category Alpha (1Y) | Relative Alpha (1Y) |
% of +ve Months
(Fund Data) |
Alpha (1Y) | Beta (1Y) |
Standard Deviation (1Y)
(Fund Data) |
Sharpe Ratio (1Y)
(Fund Data) |
Alpha (SI) | Information Ratio (SI) | Consistency Ratio % |
| Nifty 50 | 7.68% | -8.18% | 58.49% | -0.50% | 0.95 | 14.46% | -0.62 | -1.24% | -0.20 | 49.06 % |
| Nifty 500 | 4.00% | -8.72% | -4.72% | 0.84 | -2.42% | -0.49 | 47.17 % | |||
| Nifty Midcap 100 | -3.53% | -9.32% | -12.85% | 0.69 | -5.77% | -0.68 | 45.28 % | |||
| Nifty Smallcap 100 | 2.89% | -9.68% | -6.79% | 0.51 | -1.06% | -0.08 | 45.28 % | |||
| BSE 500 | 4.46% | -8.71% | -4.25% | 0.85 | -2.26% | -0.46 | 46.23 % | |||
VIEW DETAILED QUALITY, RISK, CONSISTENCY ANALYSIS
Portfolio Holdings
| Holding | % |
|---|
Sector Allocation
| Holding | % |
|---|
Market Cap Allocation
| Allocations | % |
|---|---|
| Large Cap | |
| Mid Cap | |
| Small Cap | |
| Cash |
Do Not Simply Invest, Make Informed Decisions
WISH TO MAKE INFORMED INVESTMENTS FOR LONG TERM WEALTH CREATION
Disclaimer
#Returns as of 30th Jun 2026. Returns up to 1 Year are absolute, above 1 Year are CAGR.
*QRC Report Card data is updated quarterly. Current data is as of May 26.

