

- Mid Cap portfolio of high growth emerging businesses that are existing / potential leaders in their field of operations
- Benchmark agnostic concentrated portfolio of our top 15 – 25 ideas
- Investments are made with a 3 year plus Buy & Hold view
- Bottom-up stock picking resulting in a Unique & Differentiated Portfolio

| Alpha (1Y) | Beta (1Y) | Standard Deviation (1Y) | % of +ve Months (SI) |
|---|---|---|---|
| 5.67% | 0.79 | 16.23% | 60.19% |
Portfolio Construct
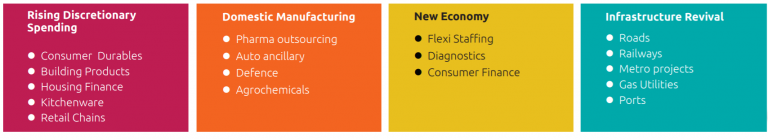
Key Investment Themes
Investment Philosophy
The endeavor is to create wealth for our investors over a medium to long term period by creating Benchmark Agnostic Concentrated Portfolios of quality stocks, based on fundamental research driven Bottom Up stock picking.
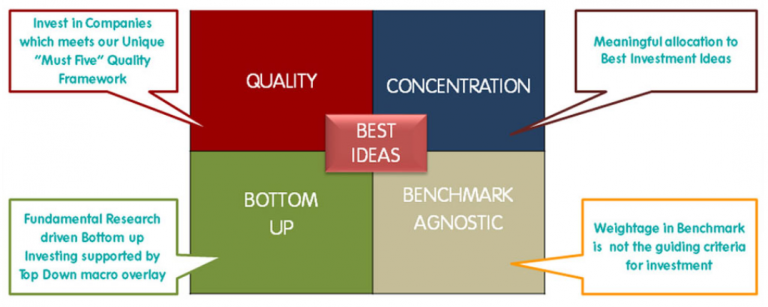
BOTTOM UP APPROACH
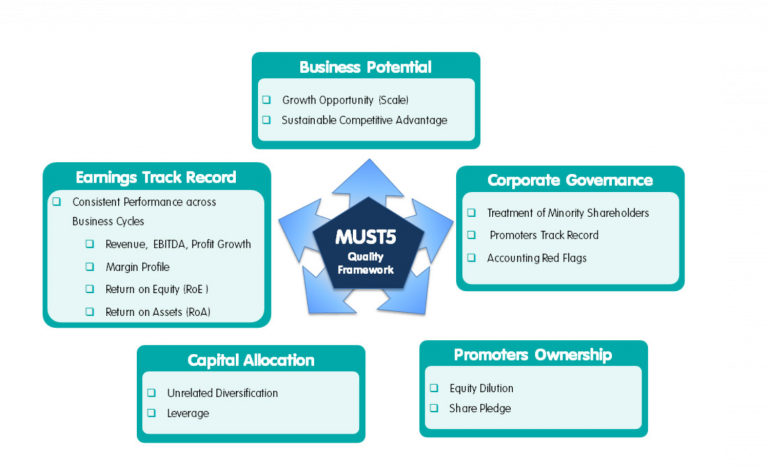
Nippon India believes that in all market conditions and across all capitalizations, there are stocks which may outperform. Hence, their Focus is on identifying such stocks, within the chosen sectors. Sectoral trends and macroeconomic research is used to identity macro trends / sectoral opportunities. The Conviction in their stock picks come from rigorous bottom up fundamental research. Fundamental Research involves study of historic track record, trends and future earning estimates through the lens of “Must 5” Quality framework.
The Assessment is based on Earnings Growth, Operating Leverage, Demand Environment, Margin Expansion, and Financial Leverage. Assessment also includes Senior Management Interaction, Key Customer, Suppliers feedback, Competition feedback, Key Stakeholders Interaction.
Post identification of stocks based on rigorous fundamental research, they identify reasonably priced stocks, based on Valuation gap analysis
- Historical Vs Current valuations
- Peer Group Valuation
- Potential Rerating Triggers
Investment is made in stocks with the Highest Conviction. Such companies tend to weather sector declines. Their endeavor is to benefit from the early identification of an investment idea; where there is higher potential for outsize returns
MUST 5 FRAMEWORK
Performance Table #
| Trailing Returns (%) | 1m return | 3m return | 6m return | 1y return | 2y return | 3y return | 5y return | 10y return | Since inception return |
|---|---|---|---|---|---|---|---|---|---|
| Nippon Life India Asset Management Ltd Emerging India | 2.86% | 5.33% | 0.46% | 5.78% | 7.18% | 18.34% | 15.91% | - | 14.94% |
| S&P BSE 500 TRI | -0.17% | -2.34% | -5.39% | -0.07% | 4.14% | 13.46% | 12.29% | - | 13.14% |
QRC Report Card *
| Strategy | Category | Fund Manager | Date of Inception | Age Of PMS | Corpus (in Cr, approx) | Benchmark | Returns SI (CAGR) | Stocks In Portfolio | Sectors In Portfolio |
|---|---|---|---|---|---|---|---|---|---|
| Nippon Life India Asset Management Ltd Emerging India | Mid Cap | Mr.Gurbir Singh Chopra | 07 April 2017 | 9Y 3M | 31.52 | S&P BSE 500 TRI | 14.94% | 30 | NA |
| Portfolio Quality (Q) | Portfolio Risk (R) | Portfolio Consistency (C) | ||||||||
|---|---|---|---|---|---|---|---|---|---|---|
| Index | Category Alpha (1Y) | Relative Alpha (1Y) |
% of +ve Months
(Fund Data) |
Alpha (1Y) | Beta (1Y) |
Standard Deviation (1Y)
(Fund Data) |
Sharpe Ratio (1Y)
(Fund Data) |
Alpha (SI) | Information Ratio (SI) | Consistency Ratio % |
| Nifty 50 | 17.60% | -12.42% | 60.19% | 5.18% | 0.93 | 16.23% | -0.22 | 2.65% | 0.21 | 54.63 % |
| Nifty 500 | 16.11% | -12.18% | 3.93% | 0.94 | 2.15% | 0.21 | 52.78 % | |||
| Nifty Midcap 100 | 8.28% | -12% | -3.72% | 0.92 | -0.01% | 0.00 | 48.15 % | |||
| Nifty Smallcap 100 | 17.76% | -12.09% | 5.67% | 0.79 | 4.62% | 0.43 | 53.70 % | |||
| BSE 500 | 16.46% | -12.17% | 4.29% | 0.95 | 2.24% | 0.22 | 52.78 % | |||
VIEW DETAILED QUALITY, RISK, CONSISTENCY ANALYSIS
Portfolio Holdings
| Holding | % |
|---|
Sector Allocation
| Holding | % |
|---|
Market Cap Allocation
| Allocations | % |
|---|---|
| Large Cap | 9.11 |
| Mid Cap | 32.73 |
| Small Cap | 32.97 |
| Cash | 25.19 |
Do Not Simply Invest, Make Informed Decisions
WISH TO MAKE INFORMED INVESTMENTS FOR LONG TERM WEALTH CREATION
Disclaimer
#Returns as of 31st May 2026. Returns up to 1 Year are absolute, above 1 Year are CAGR.
*QRC Report Card data is updated quarterly. Current data is as of Mar 26.

