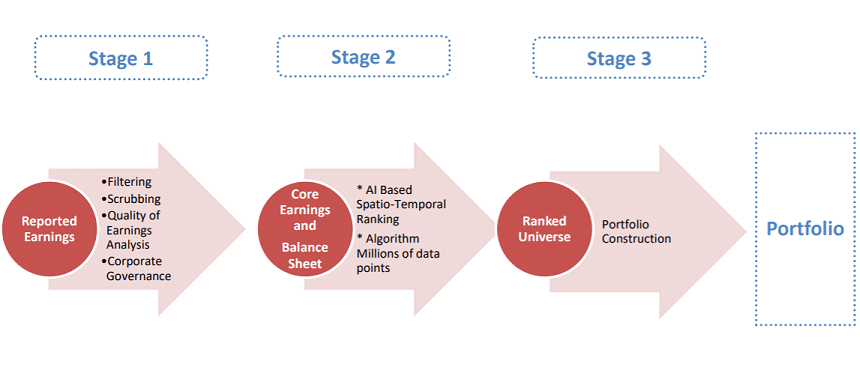
Own diversified portfolio of 12 – 35 high-quality Companies with Intelligent Ranking Algorithm / Strong focus on Business Fundamentals/Risk Management
| Alpha (1Y) | Beta (1Y) | Standard Deviation (1Y) | % of +ve Months (SI) |
|---|---|---|---|
| 10.37% | 0.95 | 16.69% | 63.49% |
Key Portfolio Attributes

Dr. Naresh Gupta
Investment Process
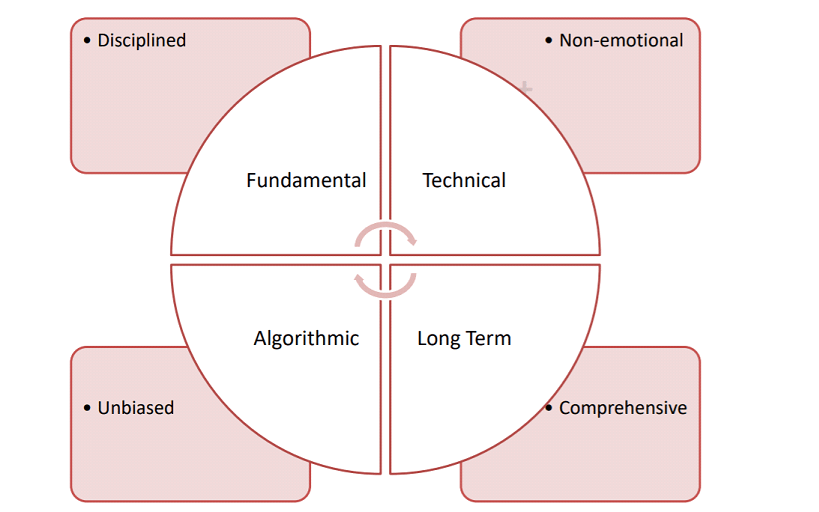
Investment Philosophy
Performance Table #
| Trailing Returns (%) | 1m return | 3m return | 6m return | 1y return | 2y return | 3y return | 5y return | 10y return | Since inception return |
|---|---|---|---|---|---|---|---|---|---|
| Accuracap Alphagen | 1.96% | 18.40% | 5.91% | 6.32% | 3.20% | 14.41% | 11.66% | 13.62% | 12.94% |
| S&P BSE 500 TRI | 1.73% | 12.10% | -3.53% | -1.96% | 1.52% | 12.53% | 12.20% | 13.92% | 13.58% |
QRC Report Card *
| Strategy | Category | Fund Manager | Date of Inception | Age Of PMS | Corpus (in Cr, approx) | Benchmark | Returns SI (CAGR) | Stocks In Portfolio | Sectors In Portfolio |
|---|---|---|---|---|---|---|---|---|---|
| Accuracap Alphagen | Multi Cap & Flexi Cap | Mr.Naresh Gupta | 31 December 2015 | 10Y 6M | 49.28 | S&P BSE 500 TRI | 12.94% | 35-40 | 5 |
| Portfolio Quality (Q) | Portfolio Risk (R) | Portfolio Consistency (C) | ||||||||
|---|---|---|---|---|---|---|---|---|---|---|
| Index | Category Alpha (1Y) | Relative Alpha (1Y) |
% of +ve Months
(Fund Data) |
Alpha (1Y) | Beta (1Y) |
Standard Deviation (1Y)
(Fund Data) |
Sharpe Ratio (1Y)
(Fund Data) |
Alpha (SI) | Information Ratio (SI) | Consistency Ratio % |
| Nifty 50 | 6.94% | 7.66% | 63.49% | 14.60% | 1.01 | 16.69% | 0.36 | 1.96% | 0.21 | 52.38 % |
| Nifty 500 | 3.35% | 7.02% | 10.37% | 0.95 | 0.58% | 0.08 | 52.38 % | |||
| Nifty Midcap 100 | -4.07% | 6.31% | 2.24% | 0.82 | -2.84% | -0.33 | 47.62 % | |||
| Nifty Smallcap 100 | 2.35% | 5.96% | 8.31% | 0.64 | 1.11% | 0.09 | 43.65 % | |||
| BSE 500 | 3.81% | 7.04% | 10.85% | 0.96 | 0.71% | 0.10 | 53.17 % | |||
VIEW DETAILED QUALITY, RISK, CONSISTENCY ANALYSIS
Portfolio Holdings
| Holding | % |
|---|
Sector Allocation
| Holding | % |
|---|---|
| Financials | 26.00 |
| Industrials | 23.00 |
| Consumer Defensive | 12.00 |
| Technology | 8.00 |
| Basic Materials | 7.00 |
Market Cap Allocation
| Allocations | % |
|---|---|
| Large Cap | 50.45 |
| Mid Cap | 28.14 |
| Small Cap | 20.63 |
| Cash | 0.78 |
Do Not Simply Invest, Make Informed Decisions
WISH TO MAKE INFORMED INVESTMENTS FOR LONG TERM WEALTH CREATION
Disclaimer
#Returns as of 30th Jun 2026. Returns up to 1 Year are absolute, above 1 Year are CAGR.
*QRC Report Card data is updated quarterly. Current data is as of May 26.