


When evaluating Portfolio Management Services (PMS) and Alternative Investment Funds (AIFs), investors often focus on historical returns, annualised performance and portfolio growth. While these metrics are important, they do not provide a complete picture of investment performance.
One important metric that investors should understand before selecting an investment strategy is drawdown.
Drawdown measures the decline in an investment’s value from its previous peak to a subsequent low. It helps investors understand the potential downside of an investment strategy and how much capital they could lose during unfavourable market conditions.
For investors comparing PMS returns in India or exploring different AIF strategies, understanding drawdown can provide valuable insights into risk management, portfolio volatility and investment consistency.
What Is Drawdown in PMS and AIF Investments?
Drawdown refers to the percentage decline in a portfolio’s value from its highest recorded value (peak) to its lowest subsequent value (trough) during a particular period.
For example, suppose an investor invests ₹50 lakh in a PMS portfolio. The portfolio value increases to ₹60 lakh before declining to ₹48 lakh due to market volatility.
The drawdown is calculated using the previous peak value of ₹60 lakh and the subsequent lowest value of ₹48 lakh.
Drawdown Formula:
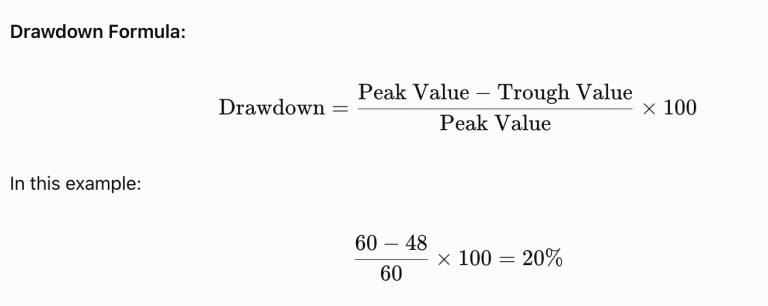 Therefore, the portfolio has experienced a 20% drawdown.
This means the investment has lost 20% of its value from its previous peak, although the overall investment may still be profitable compared with the original investment amount.
Why Is Drawdown Important When Evaluating PMS and AIFs?
Drawdown is an important risk measurement because it highlights how much an investment strategy has declined during challenging market conditions.
Here are some reasons why investors should consider drawdown while evaluating PMS and AIF investments.
1. Understanding Downside Risk
Historical returns indicate how much an investment has grown, but drawdown highlights how much investors may have experienced during market corrections.
A PMS strategy generating attractive returns with relatively controlled drawdowns may offer a different risk profile from a strategy delivering similar returns with significant portfolio declines.
2. Evaluating Fund Manager Performance
A fund manager’s ability to manage portfolio losses during market downturns is an important part of investment management.
Analysing historical drawdowns can help investors understand how effectively the investment strategy has handled different market cycles.
3. Measuring Investor Experience
Large portfolio declines can create emotional pressure and lead investors to make decisions based on short-term market movements.
Understanding historical drawdowns helps investors set realistic expectations and assess whether they can tolerate the potential volatility associated with an investment strategy.
4. Comparing Different Investment Strategies
Different PMS and AIF strategies have different risk characteristics.
For example, concentrated equity portfolios may experience larger fluctuations than diversified strategies. Similarly, certain Category 3 AIF strategies may use derivatives or leverage, potentially increasing downside exposure.
Drawdown provides an additional parameter for comparing these investment approaches.
Types of Drawdown Investors Should Understand
There are different ways to evaluate drawdown when analysing investment performance.
- Maximum Drawdown (MDD)
Maximum drawdown represents the largest percentage decline from a portfolio’s peak value to its subsequent trough over a specified period.
It helps investors understand the worst historical decline experienced by a portfolio during the measurement period.
- Current Drawdown
Current drawdown measures how far a portfolio is below its most recent peak value.
For example, if a portfolio previously reached ₹1 crore and is currently valued at ₹90 lakh, its current drawdown is 10%.
- Average Drawdown
Average drawdown measures the average decline across multiple drawdown periods. It can help investors understand the typical severity of portfolio corrections.
- Drawdown Duration
Drawdown duration measures how long a portfolio remains below its previous peak.
A portfolio may experience a 15% decline and recover within three months, while another portfolio may take two years to regain its previous high.
Both the magnitude and duration of drawdowns are important when assessing investment risk.
Drawdown vs Returns: What Should Investors Prioritise?
Investors often compare PMS strategies based on historical returns. However, focusing exclusively on returns can lead to an incomplete assessment.
Consider the following hypothetical comparison:
| Parameter | PMS Strategy A | PMS Strategy B |
| Annualised returns | 18% | 17% |
| Maximum drawdown | 12% | 25% |
| Investment approach | Moderate risk | Aggressive |
| Recovery period | Shorter | Longer |
Although both strategies generate similar annualised returns, Strategy A has experienced a significantly lower maximum drawdown.
This illustrates why PMS performance comparison should consider both returns and downside risk.
The best performing PMS in India is not necessarily the strategy with the highest historical returns. Investors should also examine consistency, risk-adjusted performance, drawdowns and the investment philosophy of the portfolio manager.
Note: The figures above are illustrative and do not represent actual PMS performance.
How to Conduct a PMS Returns Comparison Effectively?
When evaluating PMS returns in India, investors should consider multiple performance and risk indicators rather than relying on a single metric.
The following factors can help make a more meaningful comparison:
- CAGR: Measures the annualised growth rate of an investment over a specific period.
- Maximum Drawdown: Highlights the largest historical portfolio decline.
- Standard Deviation: Measures the volatility of investment returns.
- Sharpe Ratio: Evaluates returns relative to the volatility of an investment.
- Sortino Ratio: Measures returns relative to downside volatility.
- Recovery Period: Indicates how long the portfolio takes to recover from a decline.
- Benchmark Performance: Helps determine whether the portfolio has outperformed its relevant benchmark.
Investors researching the best PMS services in India should also examine the fund manager’s experience, investment philosophy, portfolio concentration, fee structure and transparency.
For a fair PMS returns comparison, ensure that the performance periods, benchmark selection and return calculation methodologies are consistent.
For example, comparing a three-year PMS return with a five-year return without accounting for different market conditions may produce misleading conclusions.
How Can Investors Manage Drawdown Risks in PMS and AIFs?
Although market risks cannot be completely eliminated, investors can take certain steps to understand and manage portfolio drawdowns.
- Diversify Investments: Avoid excessive concentration in a single stock, sector or investment strategy.
- Understand Investment Philosophy: Select strategies that align with your financial objectives and risk tolerance.
- Review Historical Performance: Study performance across different market cycles, including periods of market corrections.
- Evaluate Risk Management: Understand how portfolio managers manage volatility, liquidity and downside exposure.
- Monitor Portfolio Performance: Review investment performance periodically rather than reacting to every short-term market movement.
- Maintain an Appropriate Investment Horizon: Ensure that the investment horizon matches the strategy’s liquidity and risk characteristics.
Investors should also remember that historical drawdowns do not guarantee how a strategy will perform during future market corrections.
Conclusion
Drawdown is an essential metric for understanding the risk associated with PMS and AIF investments. While historical returns indicate the growth potential of an investment strategy, drawdown provides insights into the downside investors may experience along the way.
For investors evaluating the best performing PMS in India, comparing PMS returns or identifying the best PMS services in India, analysing maximum drawdown, recovery periods and risk-adjusted returns can support better investment decisions.
Instead of selecting a portfolio based only on its highest historical returns, investors should evaluate how consistently the strategy has generated returns while managing downside risks.
A balanced approach that considers both performance and risk can help investors build a more informed and resilient investment portfolio.
Frequently Asked Questions (FAQs)
- What is drawdown in PMS investments?
Drawdown measures the percentage decline in a PMS portfolio from its previous highest value to its subsequent lowest value.
- What is maximum drawdown in portfolio management?
Maximum drawdown is the largest peak-to-trough decline experienced by an investment portfolio during a specified period.
- Why is drawdown important when comparing PMS returns?
It helps investors understand the downside risk associated with a portfolio and evaluate whether historical returns justify the risks taken.
- Is a lower drawdown always better?
A lower drawdown may indicate better downside protection historically, but investors should also consider returns, consistency, investment strategy and market conditions.
- How is drawdown different from volatility?
Drawdown measures the decline from a previous portfolio peak, whereas volatility measures the degree of variation in investment returns over time.
- Can PMS and AIF investments recover from drawdowns?
Yes, portfolios can recover from drawdowns when their underlying investments appreciate. However, recovery is not guaranteed and can take considerable time.
- What metrics should investors compare before selecting a PMS?
Investors should evaluate CAGR, maximum drawdown, Sharpe ratio, Sortino ratio, standard deviation, recovery period and benchmark performance.

