

Date & Time: 18th March 2021, 05:30 PM – 06:30 PM IST
Speakers: Anup Maheshwari – CIO & Joint CEO, IIFL Asset Management
Moderator: Kamal Manocha – Chief Strategist, PMS AIF WORLD
Approaching Equities From The Lens of IIFL AMC’s S-C-D-V Framework
PMS AIF WORLD which is India’s one of the most trusted, new age investment platform focused on alternates, selects products with its proprietary 5-P analysis. This analysis is across – people, philosophy, portfolio, performance, price. This article explains in detail the IIFL Multi Cap PMS’s SCDV Framework Philosophy that was discussed in a recent webinar between Mr. Anup Maheshwari, CIO & Joint CEO at IIFL AMC, and Kamal Manocha, CEO PMS AIF WORLD. Mr. Anup Maheshwari, who brings with him over two decades of equities experience as a money manager, shared fine details of much-appreciated S-C-D-V Framework which has been actually pioneered by him based on his understandings and learnings of how Indian capital markets are structured.
Investment Framework
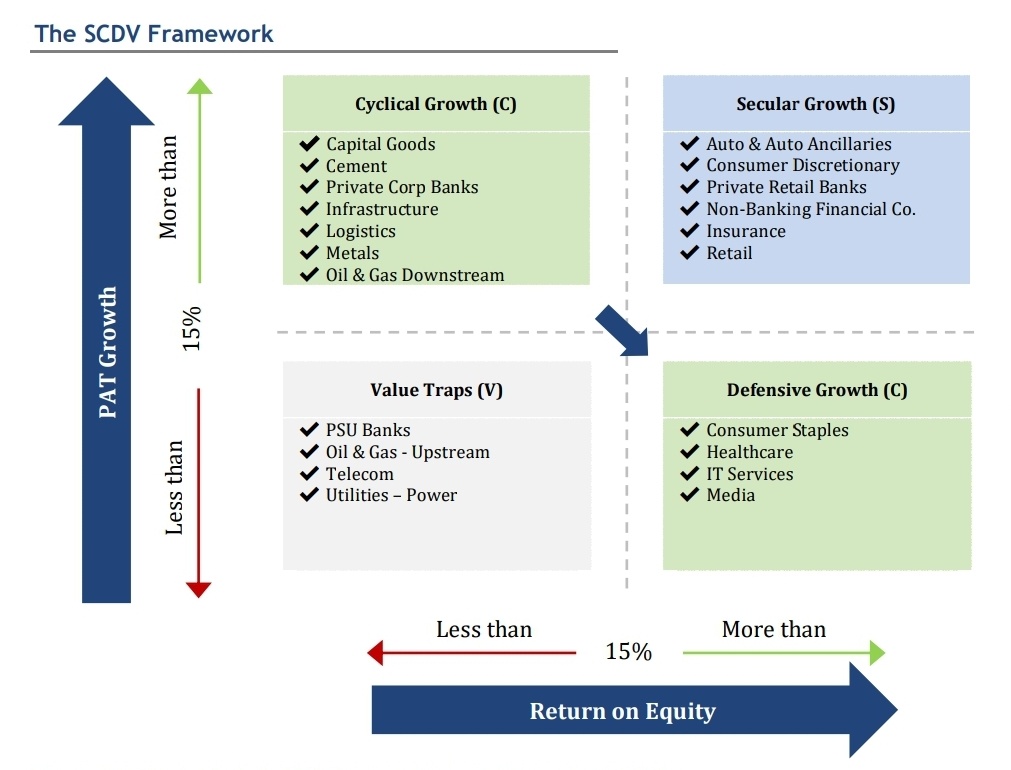
The above slide lays the foundation of IIFL AMC’s S-C-D-V Framework The genesis of the whole framework is that the two financial parameters (ROE on X-Axis and PAT on Y-Axis) have a very strong correlation with shareholder value generation. Using 15% as par (average returns + growth), and taking BSE 200 as the benchmark, the companies were mapped into these 4 quadrants.
‘S’ for Secular: A company would fit in this quadrant if it met the criteria of being above 15% on both ROE as well as PAT in at least 6/10 years (10 year rolling period is taken into consideration in this framework). The sectors mentioned in the quadrant make up about 34% of BSE 200. Secular businesses have demonstrated the ability to consistently generate shareholder return and therefore the core of the portfolio is overweight on secular.
‘C’ for Cyclicals: This includes businesses that are high on PAT but relatively low on ROE. This in some ways, includes businesses that are cyclical and economy-sensitive that tend to be more capital intensive; hence the ROE is lower but can experience high PAT when the cycle is in their favour. This makes up about 14% of BSE 200.
‘D’ for Defensives: This includes businesses that are high ROE generating businesses but relatively low on profit growth. This comprises of about 28% in BSE 200.
‘V’ for Value Traps: Value Traps are businesses that have struggled to make even 15% ROE or PAT consistently over the 10-year horizon. These are businesses that could have short-term performances but ‘the longer you tend to hold them, the worse off you could be.’ These generally constitute of heavily regulated sectors and in the BSE 200 are about 24%. The portfolio aims to ensure that its weightage on Value Traps is below 24% i.e. underweight. These are businesses that will generate value in a short term but will trap your investment if held for a longer-term.
This framework gives the flexibility to be consistent throughout, rather than being biased on one side or the other only. By keeping this flexibility between defensives and cyclicals particularly, the ability to navigate through cycles becomes easier.
Given the current scenario (in March 2021), IIFL AMC sees that we are in the top half right now v/s the bottom half as it was earlier and this is where IIFL AMC would rather operate in this particular scenario – not wanting to give up on good secular businesses and also taking advantage of the cyclical element that’s coming back into the markets.
This whole framework has been evolved through a combination of past experiences as well as quantitative testing.
The back-testing data across last two decades suggest that although the seculars show more consistent returns, but winners keep rotating across the 4 segments of Seculars – Defensives – Cyclicals – Value Traps.
SCDV Performance - Back Testing Results - Returns
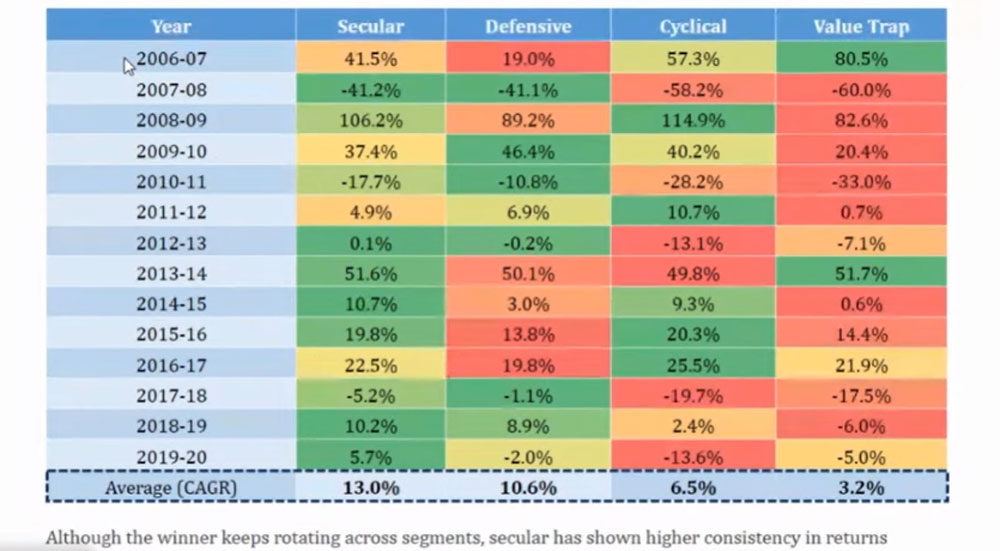
Effectively the work started in 1996. So, in 2007, to qualify the companies under respective columns in the S-C-D-V framework, it required previous 10 years’ data. As visible, every year there are changes in all 4 quadrants and thus, rebalancing is done every year. Seculars is mostly green or yellow which indicates a reasonably okay performance. As for Value Traps, it is evident that during some periods they do really well, but for the most part, it’s dark red- which indicates an inconsistent performance. Between cyclicals and defensives, things keep moving and performances keep balancing each other out. The CAGR numbers on the last row can give one a clear perspective as to why this framework works by being overweight on seculars and underweight on value traps – this flexibility helps them produce not just returns but superior consistent returns.
SCDV Performance - Back Testing Results - Churn
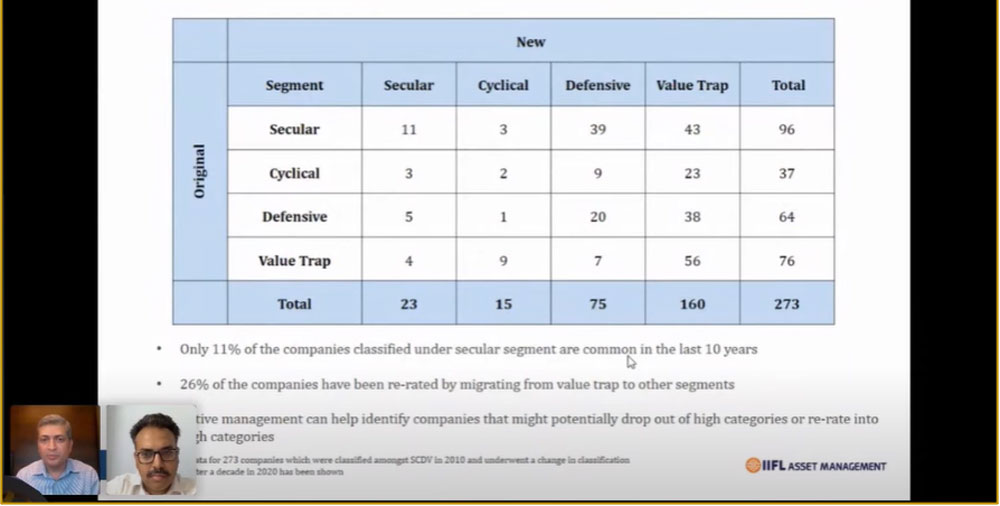
Another important factor that needs to be put into context is that the S-C-D-V framework is that a lot of businesses are not static in the those quadrants – they are quite dynamic and given the churn, a fair amount of monitoring is required which is why it is important to track these changes. For instance, it can be seen in the above slide that over the last 10 years, there were 96 seculars, 10 years ago compared to just 11 as of now from the original list. The above table shows you the starting point and the ending point and the amount of churn that has taken place. Interestingly, over the last 10 years, the value traps have increased the most – there were 76 value traps at the beginning of the period under observation and they’ve gone up to 160 by the end of the period. This just implies that the ‘economics of businesses have actually been falling consistently over the last 10 years and therefore more and more companies were actually gravitating towards the value trap segment.’ Over the next few years, when there will be an economic upturn, there will be some companies that will make way and move up the quadrant (say cyclical to secular or from value traps to defensive). Thus, portfolio returns will be better if there is a right and balanced allocation of funds between all the quadrants rather than focusing on any one of them. Keeping this notion of economic tides in mind, the IIFL Phoenix Portfolio was launched which looks at opportunities that can turn around. This means that these are businesses that had 15% ROE at some point of time, but are trading low currently, but have the potential to move up the quadrant in the coming two years.
Dichotomy Between Investors and Fund Returns
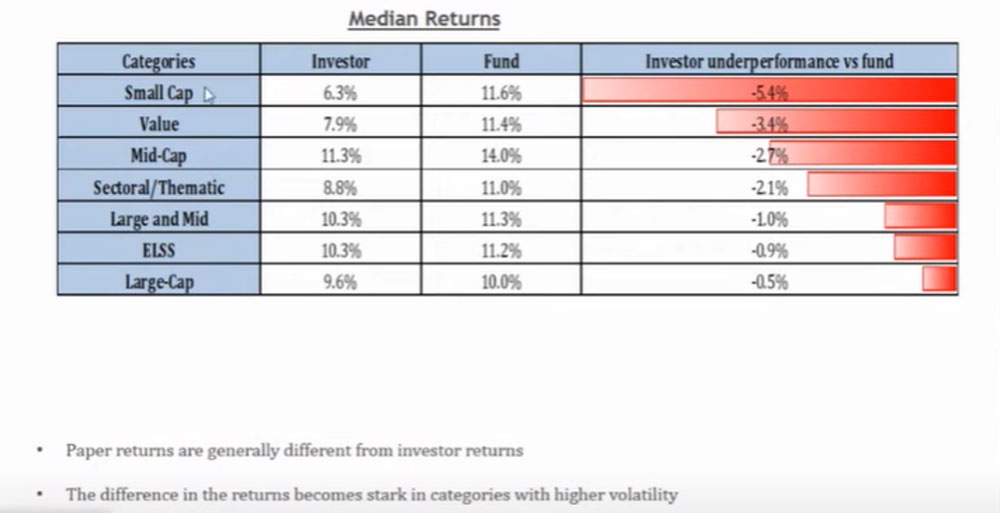
The above slide on dichotomy between investors and fund returns correlates to the point made earlier about the differences between fund returns and actual investor returns. This study was actually done by Morningstar which observes that the more volatile the category is, the worse are the investor returns relative to the fund. For instance, Small-cap funds have delivered a certain return as mentioned but the average investor experience has been far lower for the same fund; and this is observed across the table. Thus, the best policy sometimes is to identify the right philosophy, the right discipline maintained in the fund, and just sit through cycles.
The time frame of investing is a very important factor to be considered here. If the time horizon is long enough, say 10-15 years, it is okay to just sit on seculars or consistent compounders; but here also constant monitoring is required. The art of portfolio construction lies in the notion of constructing a portfolio that can be more consistent through time and the whole idea of S-C-D-V revolves around the economic characteristics that revolve around this philosophy – ‘businesses that have been generating incremental ROE and improving to a number that’s meaningful; also buying them at reasonable valuations’
There’s a very simple rule of thumb – the higher the ROE, the higher will be the Price to Book Value (P-BV) and the market makes a lot of mispricing on price to book terms depending on the near term ROE. For instance, Hindalco, which is in the business of making aluminium, is very power-intensive and so it is a capital-intensive business. It takes thousands of crores to set up the aluminium plant and is a very economy-sensitive biz.- even if the economy is not doing well and the company is not selling, it still has to keep the plants running- so there’s a good amount of fixed costs involved and thus, PAT gets impacted accordingly. So in bad times Hindalco’s ROE may fall down to 2-3%, whereas in good times it can move up to even 20%. Now when ROE is at 20%, the market assumes that this will stay the same forever and will give it a 3 times P-BV. When the ROE is 3%, the market assumes this will stay forever and the stock will start trading below BV. This is the anomaly of the market and these mis-pricings occur when markets mis-price the future ROE or PAT of the business. This is where the flexibility comes in and the advantage of mis-pricing is taken in whichever quadrant it falls in.
As far as market allocation is considered, Seculars may comprise of large, mid and small- the entire range; Cyclicals mainly focus on large caps (risk is taken only on large caps as they are generally liquid and backed by known promoters that provide the ability to navigate risk); Small caps are looked at in Defensives- small caps with good management, clean balance sheet, low debt, and a growth base.
With such a mix of market allocation and the flexibility to jump between quadrants is what makes the S-C-D-V framework unique!
RISK DISCLAIMER: Investments are subject to market-related risks. This write up is meant for general information purposes and not to be construed as any recommendation or advice. The investor must make their own analysis and decision depending upon risk appetite. Only those investors who have an aptitude and attitude to risk should consider the space of Alternates (PMS & AIFs). Past Performance may or may not be sustained in the future and should not be used as a basis for comparison with other investments. Please read the disclosure documents carefully before investing. PMS & AIF products are market-linked and do not offer any guaranteed/assured returns. These are riskier investments, with a risk to principal amount as well. Thus, investors must make informed decisions. It is necessary to deep dive not only into the performance, but also into people, philosophy, portfolio, and price, before investing. We, at PMS AIF WORLD do such a detailed 5 P analysis.
Wish to make INFORMED INVESTMENTS for Long Term WEALTH CREATION

