

Charmi Shah
Content & Analysis,
PMS AIF WORLD
Which is better – Portfolio Management Services or Mutual Funds?
We have curated a detailed score card to analyse the performance of both. A comparison has been done between MFs and PMSs (data has been considered as of 31.03.2024 for both, and returns displayed here are net of all expenses and gross of taxes) and the infographics of the same are given below.
If you had invested INR 50 lakhs each in the basket of Top 5 Equity Mutual Funds v/s in Top 5 Portfolio Management Services over the last 1,2,3,5, and 10 Years, where would you end up?
Check out the numbers below!
For high performance investing, which is better – Portfolio Management Services or Mutual Funds?
Here we present a simple analysis to address some real questions asked by investors today – Where should you invest – Portfolio Management Services (PMS) or Mutual Funds (MF)?
While both are well regulated and credible structures meant to out-perform equity market indices, objective performance analysis conveys that it is the PMSs that have generated significantly higher alpha and so, are righty considered to be wealth-creating vehicles.
10Y Returns Comparison – Across All Categories
| TOP 5 PMSs- 10Y Returns (Across all categories) | ||
| Scheme Name | AuM (Cr) | Annualized Returns |
| Aequitas Investment India Opportunities PMS | 3149.16 | 34.92% |
| Master Trust India Growth PMS | 502.75 | 28.72% |
| Globe Capital Value PMS | 817.14 | 26.40% |
| Nine Rivers capital Aurum Small Cap Opportunities PMS | 730.00 | 25.97% |
| SageOne Investment Core Portfolio | 3490.00 | 24.00% |
| TOP 5 MFs- 10Y Returns (Across all categories) | ||
| Scheme Name | AuM (Cr) | Annualized Returns |
| Nippon India Small Cap Fund | 46044.13 | 26.44% |
| SBI Small Cap Fund | 25434.98 | 25.57% |
| Quant Flexi Cap Fund | 4154.65 | 23.39% |
| DSP Small Cap Fund | 13709.97 | 22.87% |
| Quant Active Fund | 8466.76 | 22.84% |
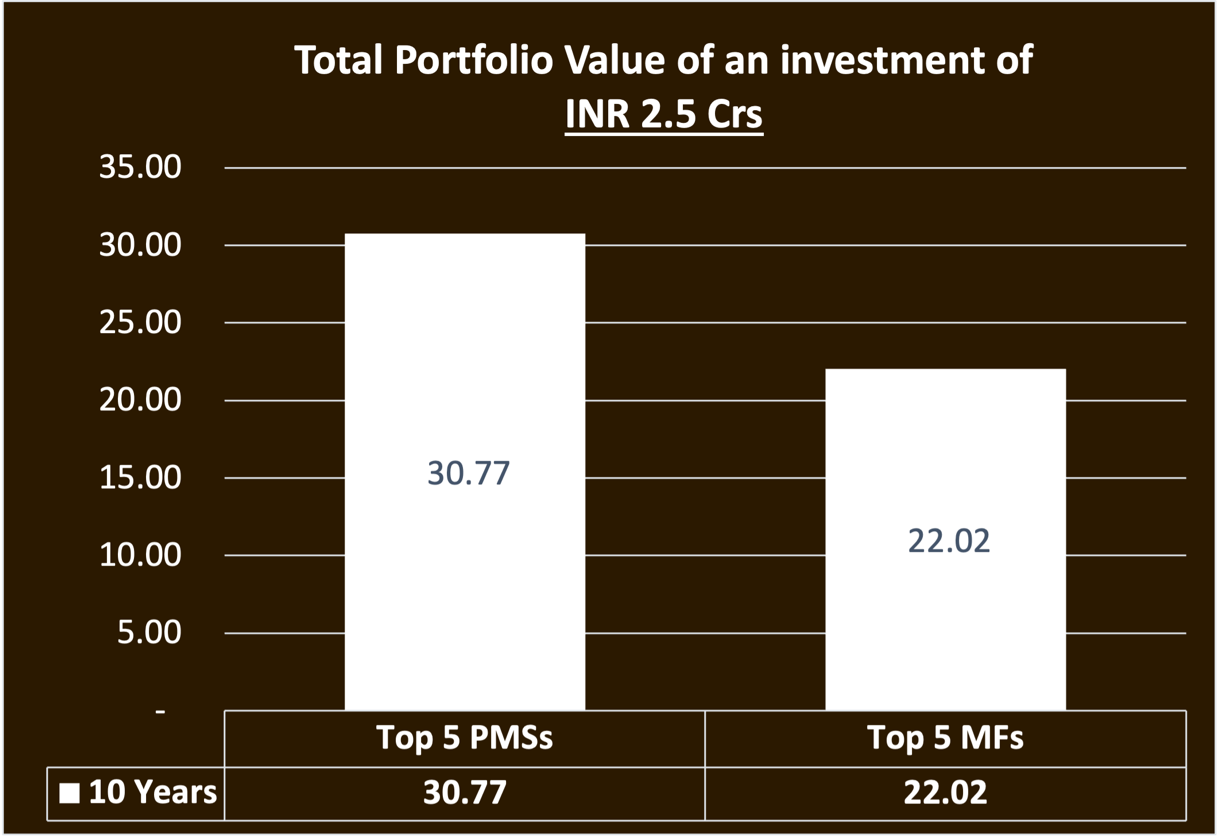
Conclusion: If one had invested Rs 2.5 Crs in these top 5 PMSs on 1st April 2014, rather than in the top 5 MFs, over a period of 10 years, one would have generated Rs 8.75 Crs more.
5Y Returns Comparison – Multi Cap
| TOP 5 PMSs- 5Y Returns (Multi Cap Fund) | ||
| Scheme Name | AuM (Cr) | Annualized Returns |
| ValueQuest Platinum Scheme PMS | 1529.00 | 30.16% |
| Sameeksha Capital Equity PMS | 1202.00 | 29.90% |
| Stallion Asset Core PMS | 1407.00 | 29.89% |
| Globe Capital Value PMS | 817.14 | 29.23% |
| Globe Capital Arbitrage PMS | 269.23 | 27.87% |
| TOP 5 MFs- 5Y Returns (Regular Plan, Multi/Flexi Cap Fund) | ||
| Scheme Name | AuM (Cr) | Annualized Returns |
| Quant Flexi Cap Fund | 4154.65 | 28.65% |
| Quant Active Fund | 8466.76 | 27.33% |
| Parag Parikh Flexi Cap Fund | 60559.43 | 22.71% |
| Axis Growth Opportunities Fund | 11310.89 | 21.04% |
| ICICI Prudential Large & Mid Cap Fund | 11333.37 | 20.48% |
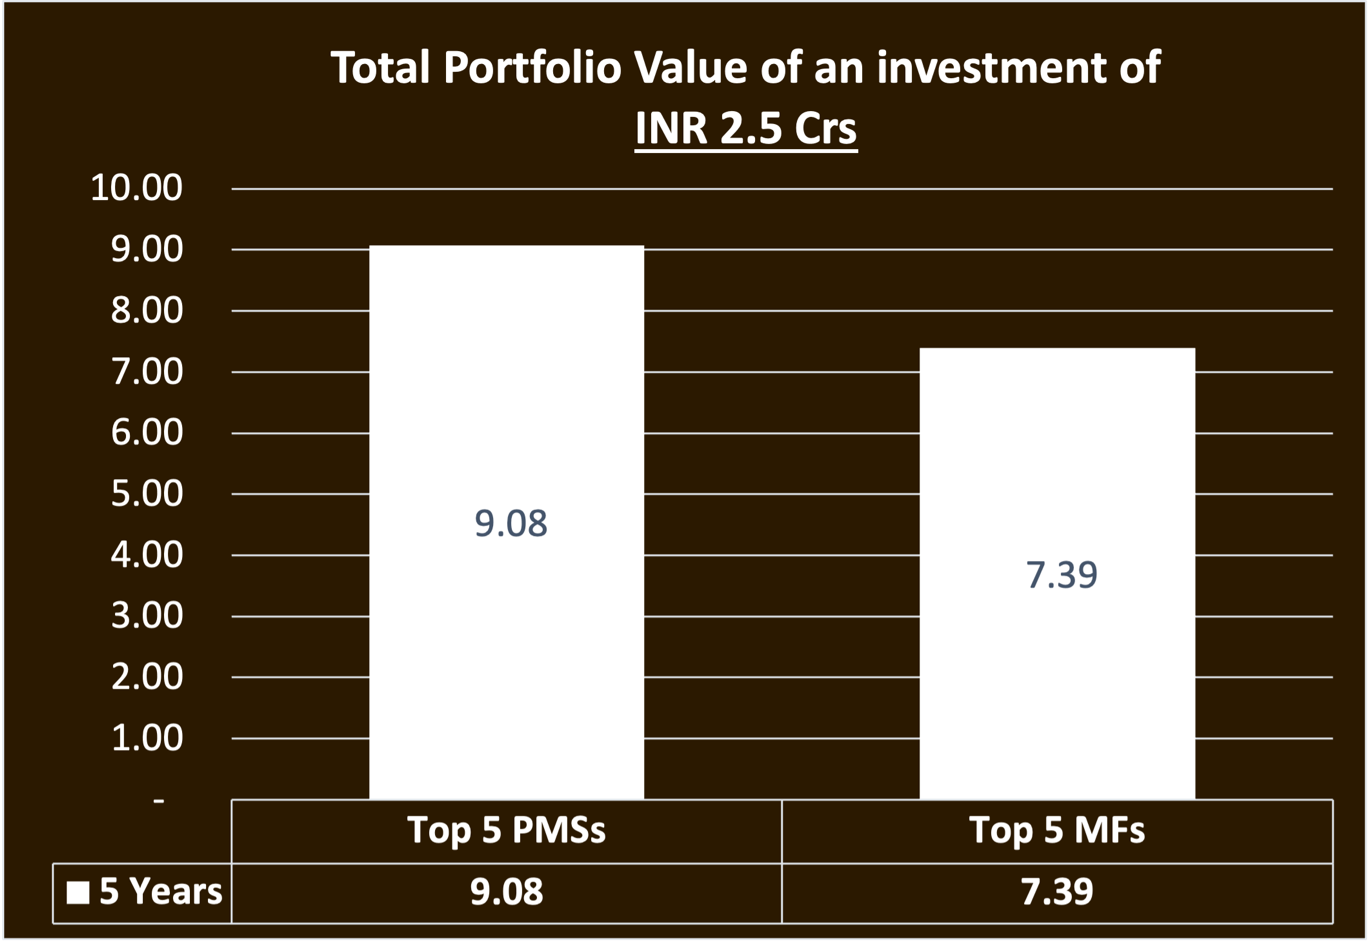
Conclusion: If one had invested Rs 2.5 Crs in these top 5 PMSs on 1st April 2019, rather than in the top 5 MFs, over a period of 5 years, one would have generated Rs 1.68 Crs more.
5Y Returns Comparison – Mid & Small Cap
| TOP 5 PMSs- 5Y Returns (Mid & Small Cap Fund) | ||
| Scheme Name | AuM (Cr) | Annualized Returns |
| Green Lantern Capital LLP Growth PMS | 406.49 | 37.87% |
| UNIFI APJ 20 PMS | 620.50 | 29.03% |
| Aequitas Investment India Opportunities PMS | 3149.16 | 28.88% |
| Equirus Long Horizon PMS | 851.87 | 27.11% |
| UNIFI Blended Fund-Rangoli PMS | 12857.00 | 26.83% |
| TOP 5 MFs- 5Y Returns (Regular Plan, Mid & Small Cap Fund) | ||
| Scheme Name | AuM (Cr) | Annualized Returns |
| Quant Small Cap Fund | 17193.09 | 34.60% |
| Nippon India Small Cap Fund | 46044.13 | 28.27% |
| Canara Robeco Small Cap Fund | 9594.98 | 25.43% |
| Tata Small Cap Fund | 6289.22 | 24.93% |
| Invesco India Smallcap Fund | 3705.37 | 24.77% |
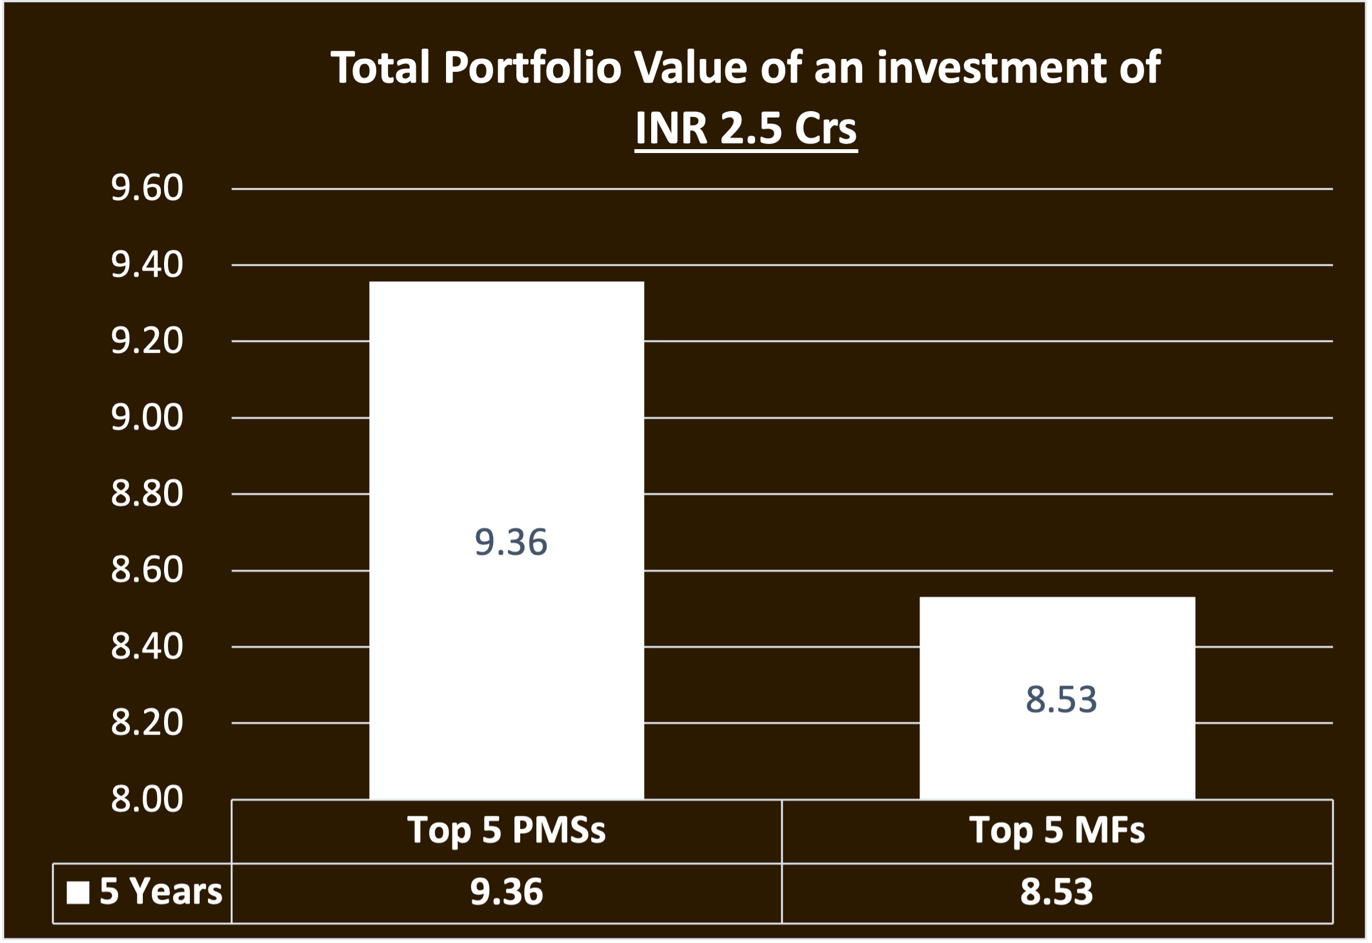
Conclusion: If one had invested Rs 2.5 Crs in these top 5 PMSs on 1st April 2019, rather than in the top 5 MFs, over a period of 5 years, one would have generated Rs 0.83 Crs more.
3Y Returns Comparison – Multi Cap
| TOP 5 PMSs- 3Y Returns (Multi Cap Fund) | ||
| Scheme Name | AuM (Cr) | Annualized Returns |
| Carnelian Capital Shift PMS | 1407.00 | 37.30% |
| Invasset LLP Growth PMS | 232.93 | 36.97% |
| Unique Asset Management Strategic PMS | 1247.65 | 35.39% |
| ICICI Prudential PMS Value PMS | 300.10 | 34.37% |
| Ambit Global Private Client Alpha Growth PMS | 402.000 | 33.70% |
| TOP 5 MFs- 3Y Returns (Regular Plan, Multi/Flexi Cap Fund) | ||
| Scheme Name | AuM (Cr) | Annualized Returns |
| Quant Flexi Cap Fund | 4154.65 | 32.23% |
| Nippon India Multicap Fund | 26808.69 | 28.86% |
| Quant Active Fund | 8466.76 | 26.31% |
| ICICI Prudential Large & Mid Cap Fund | 11333.37 | 25.89% |
| HDFC Flexi Cap Fund | 49656.92 | 25.62% |
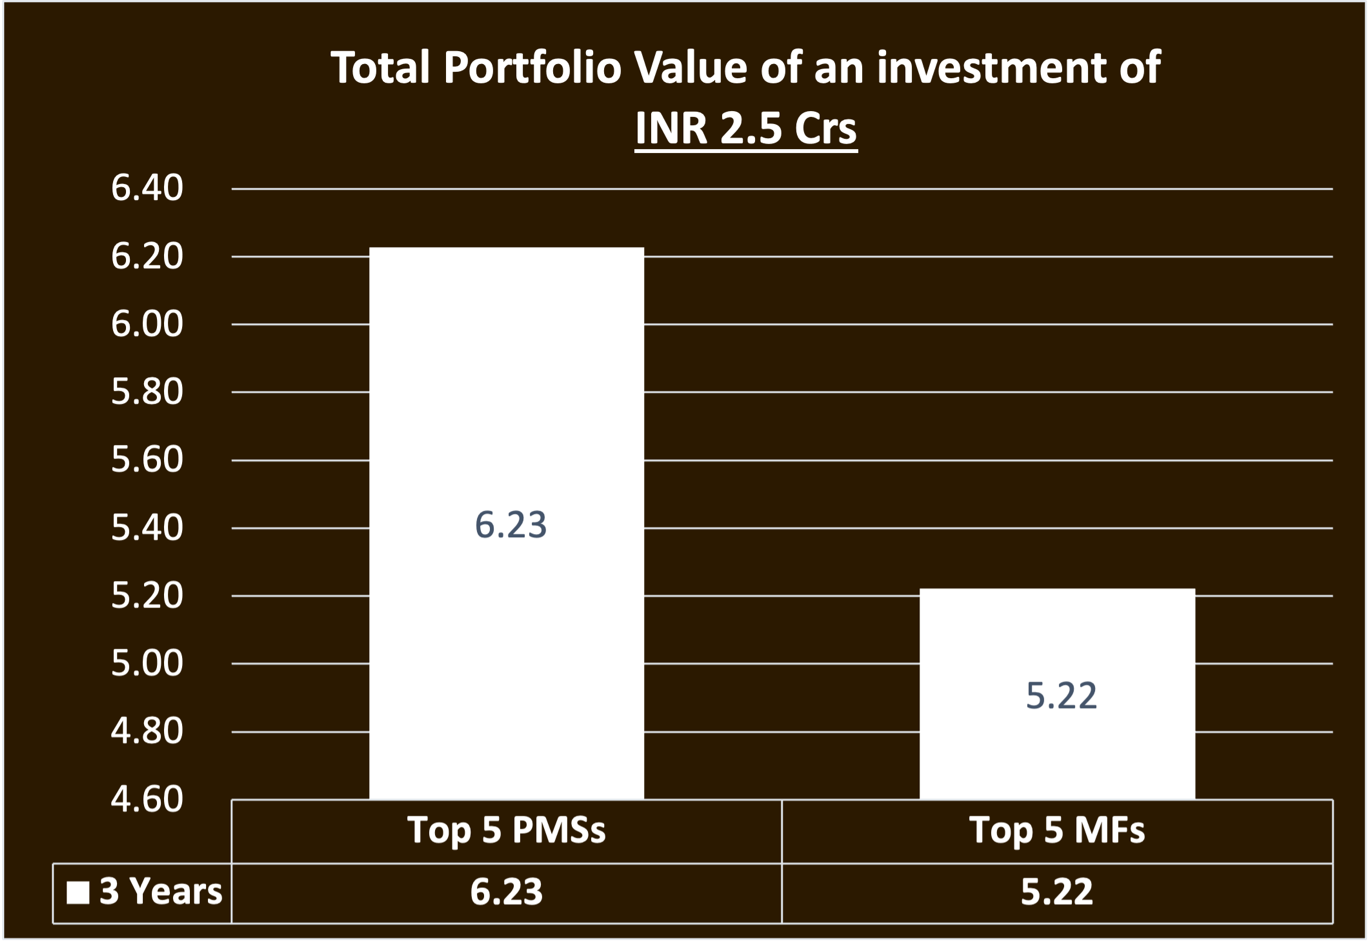
Conclusion: If one had invested Rs 2.5 Crs in these top 5 PMSs on 1st April 2021, rather than in the top 5 MFs, over a period of 3 years, one would have generated Rs 1.01 Crs more.
3Y Returns Comparison – Mid & Small Cap
| TOP 5 PMSs- 3Y Returns (Mid & Small Cap Fund) | ||
| Scheme Name | AuM (Cr) | Annualized Returns |
| Counter Cyclical Investments – Diversified Long Term Value PMS | 577.04 | 58.95% |
| Green Lantern Capital LLP Growth PMS | 406.49 | 58.72% |
| Aequitas Investment India Opportunities PMS | 3149.16 | 55.31% |
| Electrum Laureate PMS | 283.00 | 37.10% |
| Equitree Emerging Opportunities PMS | 177.79 | 35.99% |
| TOP 5 MFs- 3Y Returns (Regular Plan, Mid & Small Cap Fund) | ||
| Scheme Name | AuM (Cr) | Annualized Returns |
| Quant Small Cap Fund | 17193.09 | 39.10% |
| Nippon India Small Cap Fund | 46044.13 | 32.93% |
| HSBC Small Cap Fund | 13746.58 | 31.55% |
| HDFC Small Cap Fund | 28598.92 | 29.85% |
| Franklin India Smaller Companies Fund | 11822.68 | 29.44% |
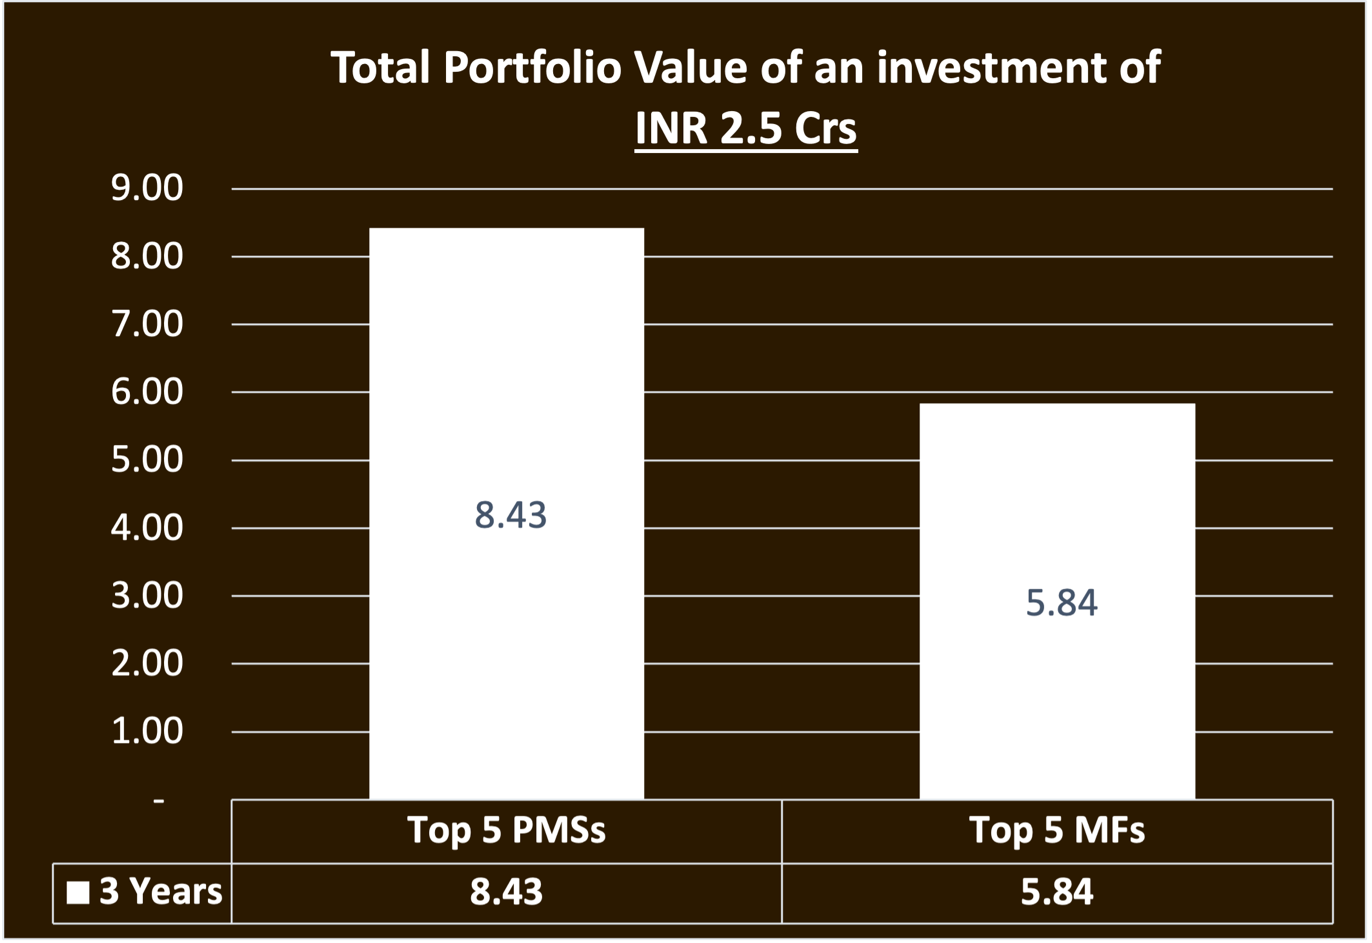
Conclusion: If one had invested Rs 2.5 Crs in these top 5 PMSs on 1st April 2021, rather than in the top 5 MFs, over a period of 3 years, one would have generated Rs 2.59 Crs more.
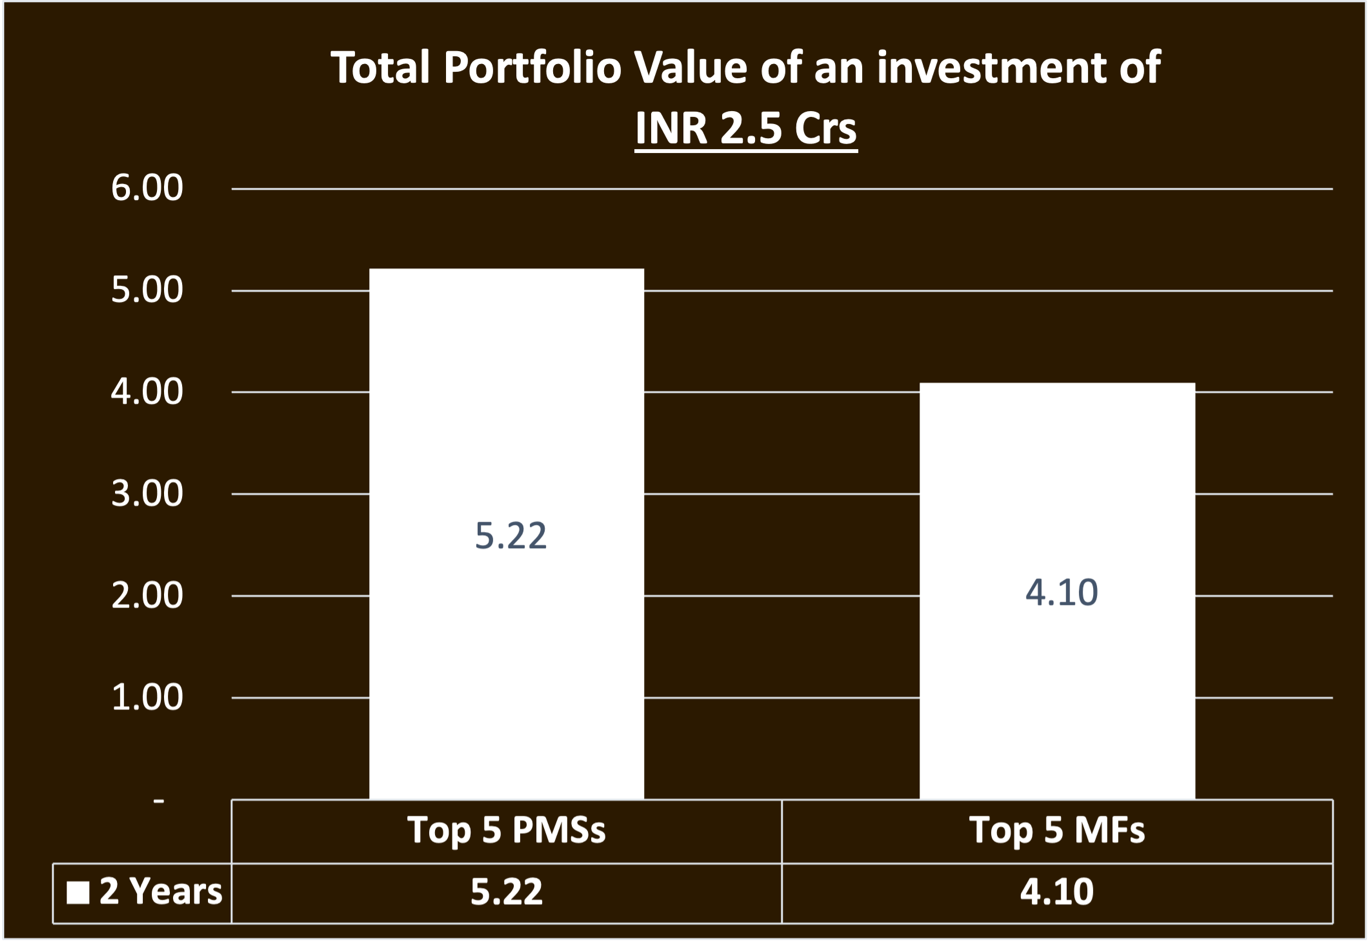
2Y Returns Comparison – Multi Cap
| TOP 5 PMSs- 2Y Returns (Multi Cap Fund) | ||
| Scheme Name | AuM (Cr) | Annualized Returns |
| Samvitti Capital Active Alpha Multicap PMS | 191.71 | 49.72% |
| Invasset LLP Growth PMS | 232.93 | 45.35% |
| Unique Asset Management Strategic PMS | 1247.65 | 38.27% |
| ICICI Prudential PMS Value PMS | 300.10 | 36.16% |
| Samvitti Capital Aggressive Growth PMS | 250.16 | 35.10% |
| TOP 5 MFs- 2Y Returns (Regular Plan, Multi/Flexi Cap Fund) | ||
| Scheme Name | AuM (Cr) | Annualized Returns |
| HDFC Multicap Fund | 12231.81 | 26.53% |
| Nippon India Multicap Fund | 26808.69 | 26.31% |
| Bandhan Core Equity Fund | 3883.52 | 25.56% |
| Quant Flexi Cap Fund | 4154.65 | 25.51% |
| HDFC Flexi Cap Fund | 49656.92 | 24.81% |
Conclusion: If one had invested Rs 2.5 Crs in these top 5 PMSs on 1st April 2022, rather than in the top 5 MFs, over a period of 2 years, one would have generated Rs 1.02 Crs more.
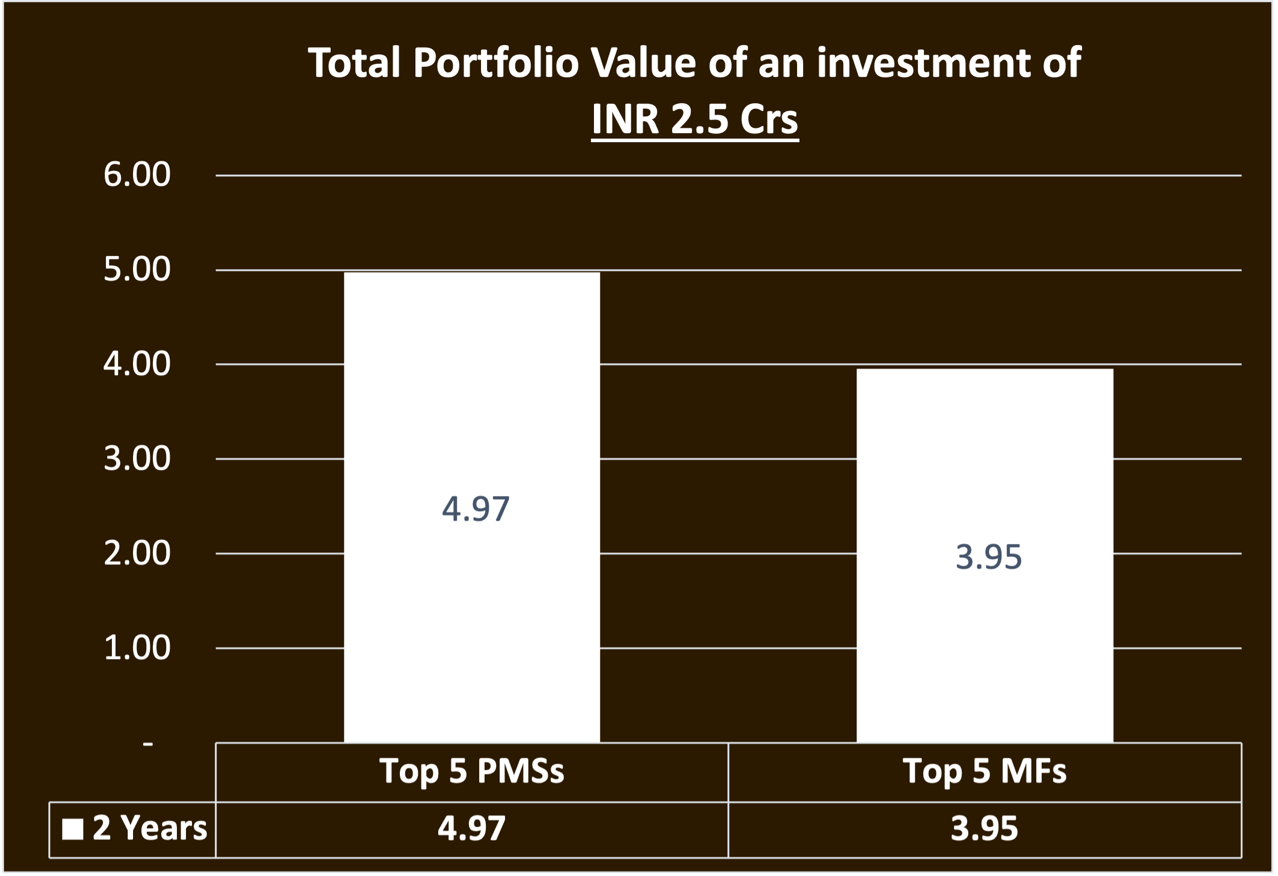
2Y Returns Comparison – Mid & Small Cap
| TOP 5 PMSs- 2Y Returns (Mid & Small Cap Fund) | ||
| Scheme Name | AuM (Cr) | Annualized Returns |
| Green Lantern Capital LLP Growth PMS | 406.49 | 60.41% |
| Aequitas Investment India Opportunities PMS | 3149.16 | 47.97% |
| Molecule Ventures Growth PMS | 459.72 | 45.64% |
| Counter Cyclical Investments – Diversified Long Term Value PMS | 577.04 | 34.87% |
| ICICI Prudential PMS PIPE PMS | 4792.60 | 31.54% |
| TOP 5 MFs- 2Y Returns (Regular Plan, Mid & Small Cap Fund) | ||
| Scheme Name | AuM (Cr) | Annualized Returns |
| Quant Small Cap Fund | 17193.09 | 30.48% |
| Franklin India Smaller Companies Fund | 11822.68 | 27.89% |
| Nippon India Small Cap Fund | 46044.13 | 27.88% |
| HDFC Small Cap Fund | 28598.92 | 27.69% |
| Bandhan Small Cap Fund | 4389.28 | 26.13% |
Conclusion: If one had invested Rs 2.5 Crs in these top 5 PMSs on 1st April 2022, rather than in the top 5 MFs, over a period of 2 years, one would have generated Rs 1.12 Crs more.
1Y Returns Comparison – Multi Cap
| TOP 5 PMSs- 1Y Returns (Multi Cap Fund) | ||
| Scheme Name | AuM (Cr) | Annualized Returns |
| Invasset LLP Growth PMS | 232.93 | 128.47% |
| Samvitti Capital Active Alpha Multicap PMS | 191.71 | 98.40% |
| Ambit Global Private Client Alpha Growth PMS | 402.00 | 94.80% |
| Shepherd’s Hill Value Mango PMS | 104.49 | 89.48% |
| Samvitti Capital Aggressive Growth PMS | 250.16 | 83.66% |
| TOP 5 MFs- 1Y Returns (Regular Plan, Multi/Flexi Cap Fund) | ||
| Scheme Name | AuM (Cr) | Annualized Returns |
| Quant Flexi Cap Fund | 4154.65 | 57.28% |
| Bandhan Core Equity Fund | 3883.52 | 52.72% |
| Nippon India Multicap Fund | 26808.69 | 49.99% |
| Quant Active Fund | 8466.76 | 49.47% |
| HDFC Multicap Fund | 12231.81 | 48.97% |
Conclusion: If one had invested Rs 2.5 Crs in these top 5 PMSs on 1st April 2023, rather than in the top 5 MFs, over a period of 1 year, one would have generated Rs 1.18 Crs more.
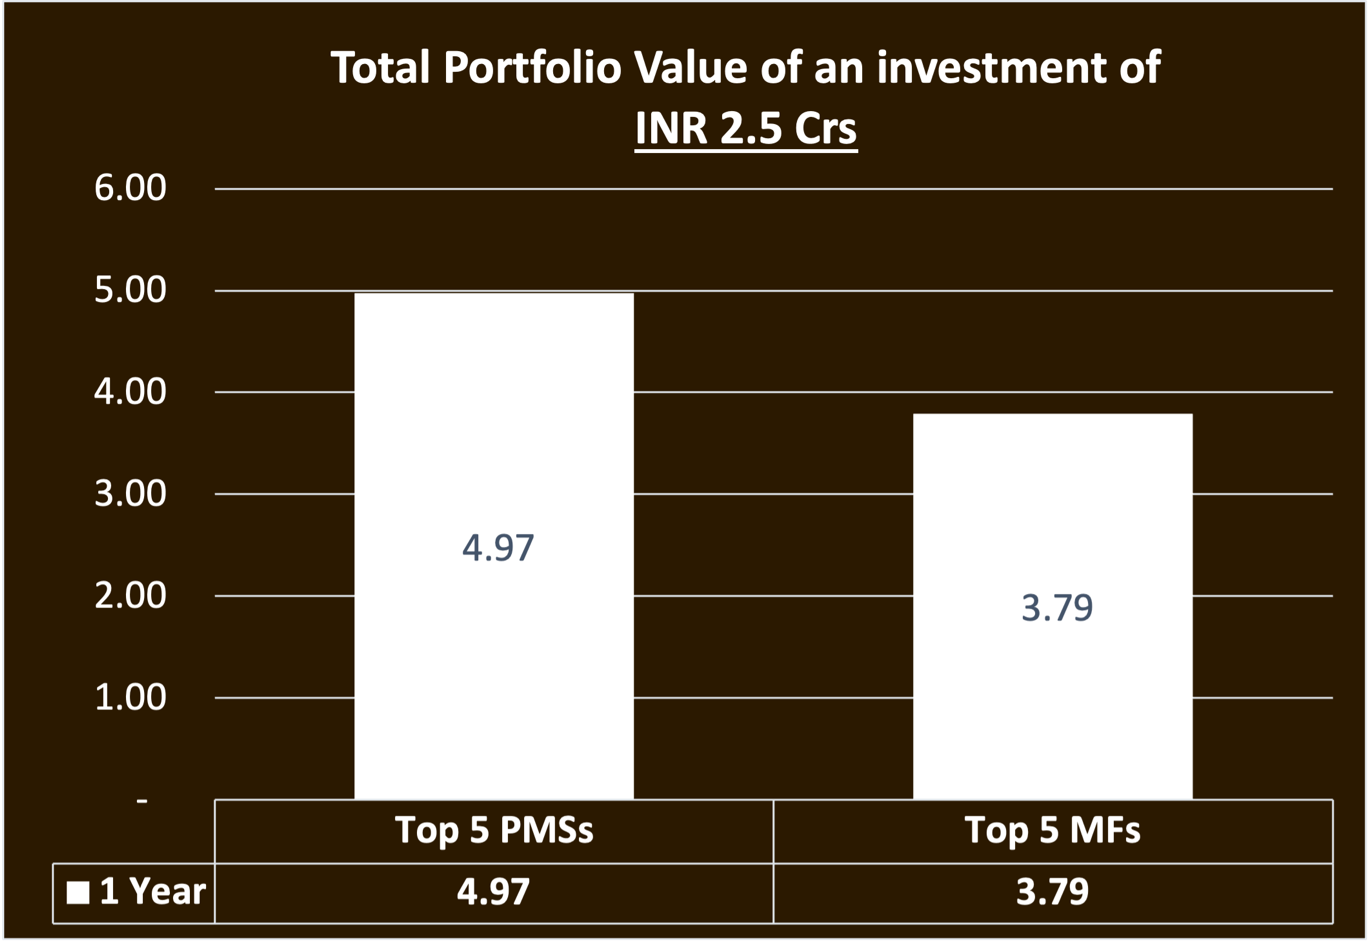
1Y Returns Comparison – Mid & Small Cap
| TOP 5 PMSs- 1Y Returns (Mid & Small Cap Fund) | ||
| Scheme Name | AuM (Cr) | Annualized Returns |
| Green Lantern Capital LLP Growth PMS | 406.49 | 110.79% |
| Aequitas Investment India Opportunities PMS | 3149.16 | 82.83% |
| Roha Asset Managers Emerging Champions PMS | 436.00 | 76.64% |
| Motilal Oswal AMC Mid to Mega PMS | 1425.00 | 68.03% |
| SageOne Investment Core PMS | 3490.00 | 66.30% |
| TOP 5 MFs- 1Y Returns (Regular Plan, Mid & Small Cap Fund) | ||
| Scheme Name | AuM (Cr) | Annualized Returns |
| Bandhan Small Cap Fund | 4389.28 | 69.29% |
| Quant Small Cap Fund | 17193.09 | 66.27% |
| Mahindra Manulife Small Cap Fund | 3526.63 | 65.59% |
| Nippon India Small Cap Fund | 46044.13 | 55.14% |
| HSBC Mid Cap Fund | 9724.77 | 54.91% |
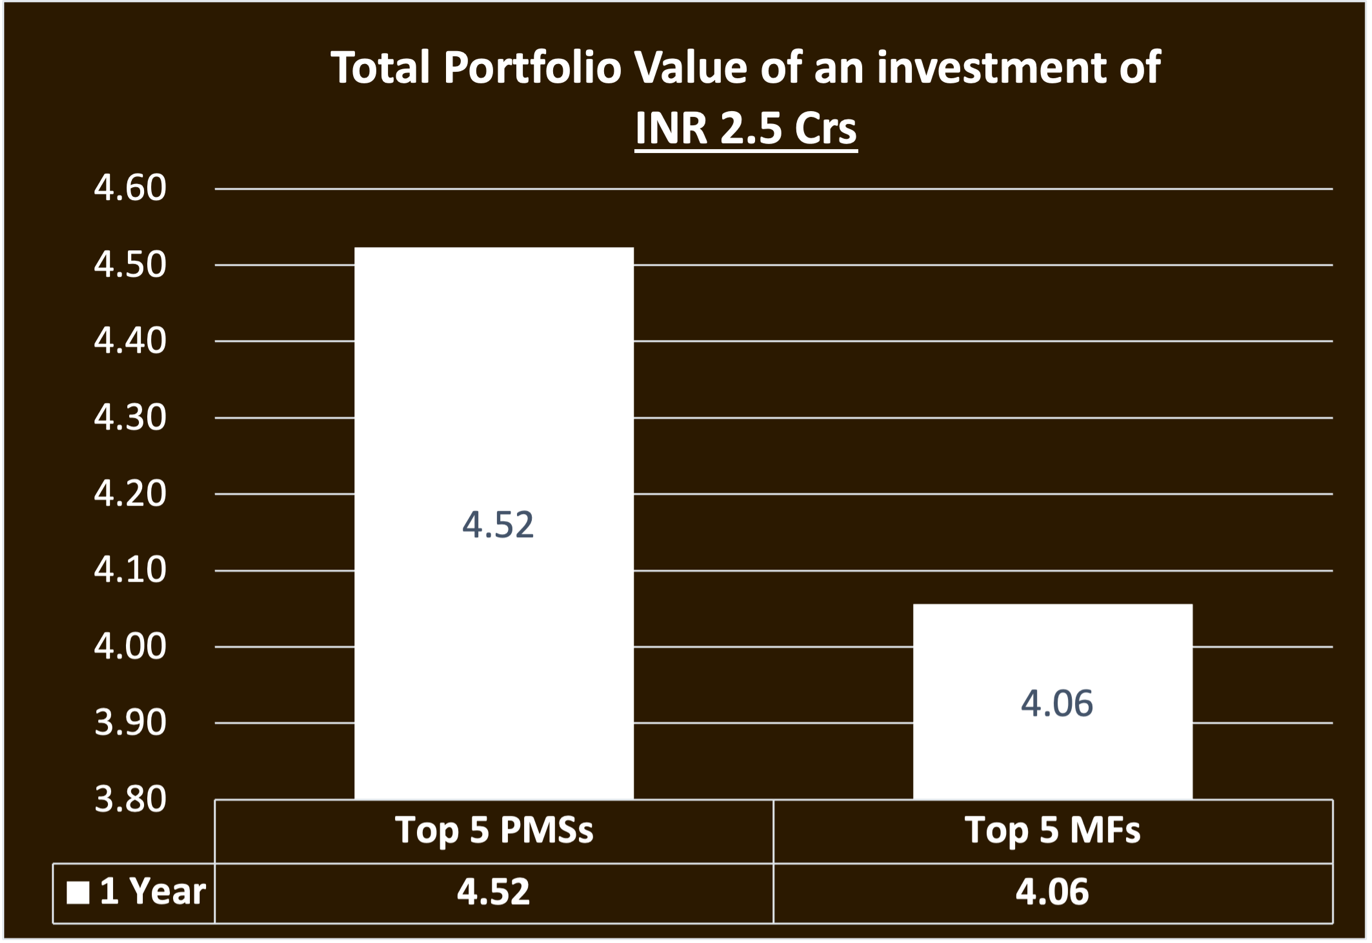
Conclusion: If one had invested Rs 2.5 Crs in these top 5 PMSs on 1st April 2023, rather than in the top 5 MFs, over a period of 1 year, one would have generated Rs 0.47 Crs more.
Wish to make INFORMED INVESTMENTS for Long Term WEALTH CREATION