

Wealth Management Industry is not designed to be Fair. There are hundreds of products and strategies that waste time and money. A strict discipline is required, and one must practice caution while investing. It is easy to socialize and sell, which is what most sales-driven wealth management companies do. But it is equally difficult to maintain insight and integrity, which is what drives us.
PMS AIF WORLD provides analytics & content backed quality investment services. It is easy to socialize and sell, which is what most sales-driven wealth management companies do. But it is equally difficult to maintain insight and integrity, which is what drives us. Our focus is Performance, and we are driven by meaningful analytics.
10Y Returns Comparison – Across All Categories
| TOP 5 PMSs- 10Y Returns (Across all categories) | ||
| Scheme Name | AuM (Cr) | Annualized Returns |
| Aequitas Investment India Opportunities Product | 2726.10 | 38.38% |
| Master Trust India Growth Strategy | 521.52 | 32.53% |
| Nine Rivers capital Aurum Small Cap Opportunities | 458.00 | 32.15% |
| SageOne Investment Core Portfolio | 2750.00 | 27.25% |
| AccuraCap PicoPower | 629.64 | 26.32% |
| TOP 5 MFs- 10Y Returns (Across all categories) | ||
| Scheme Name | AuM (Cr) | Annualized Returns |
| Nippon India Small Cap Fund | 37,374.40 | 29.69% |
| SBI Small Cap Fund – Regular Plan | 21,319.60 | 27.15% |
| DSP Small Cap Fund – Regular Plan | 12,097.83 | 25.81% |
| Mirae Asset Emerging Bluechip Fund | 29,024.00 | 24.59% |
| Kotak Emerging Equity Fund | 33,918.27 | 23.88% |
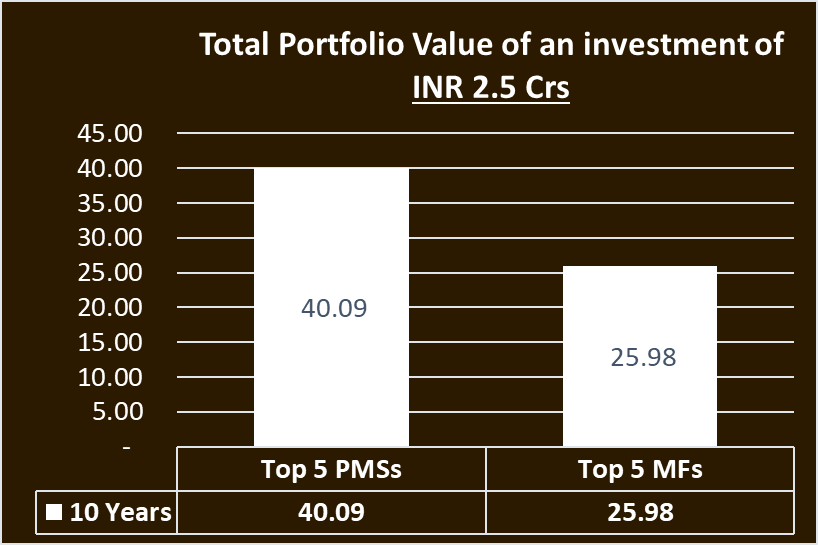
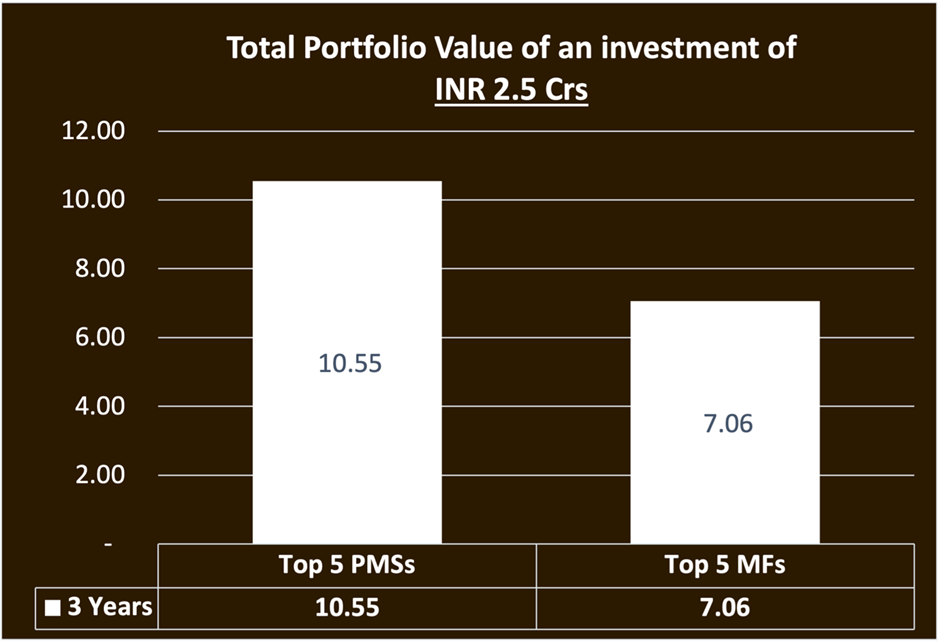
Conclusion: If one had invested Rs 2.5 Crs in these top 5 PMSs on 1st October 2013, rather than in the top 5 MFs, over a period of 10 years, one would have generated Rs 14.11 Crs more.
5Y Returns Comparison – Multi Cap
| TOP 5 PMSs- 5Y Returns (Multi Cap Fund) | ||
| Scheme Name | AuM (Cr) | Annualized Returns |
| Sameeksha Capital Equity Fund | 913.69 | 30.80% |
| Green Portfolio Special | 240.75 | 29.63% |
| ValueQuest Platinum Scheme | 659.65 | 29.36% |
| Globe Capital Value PMS | 443.00 | 26.91% |
| Negen Capital Special Situations Fund | 619.63 | 26.84% |
| TOP 5 MFs- 5Y Returns (Regular Plan, Multi/Flexi Cap Fund) | ||
| Scheme Name | AuM (Cr) | Annualized Returns |
| Quant Active Fund | 6,018.00 | 23.68% |
| Parag Parikh Flexi Cap Fund | 42,784.56 | 19.16% |
| Mirae Asset Emerging Bluechip Fund | 29,024.00 | 18.69% |
| Nippon India Multi Cap Fund | 20,930.00 | 18.65% |
| HDFC Large and Mid Cap Fund | 11,810.08 | 17.64% |
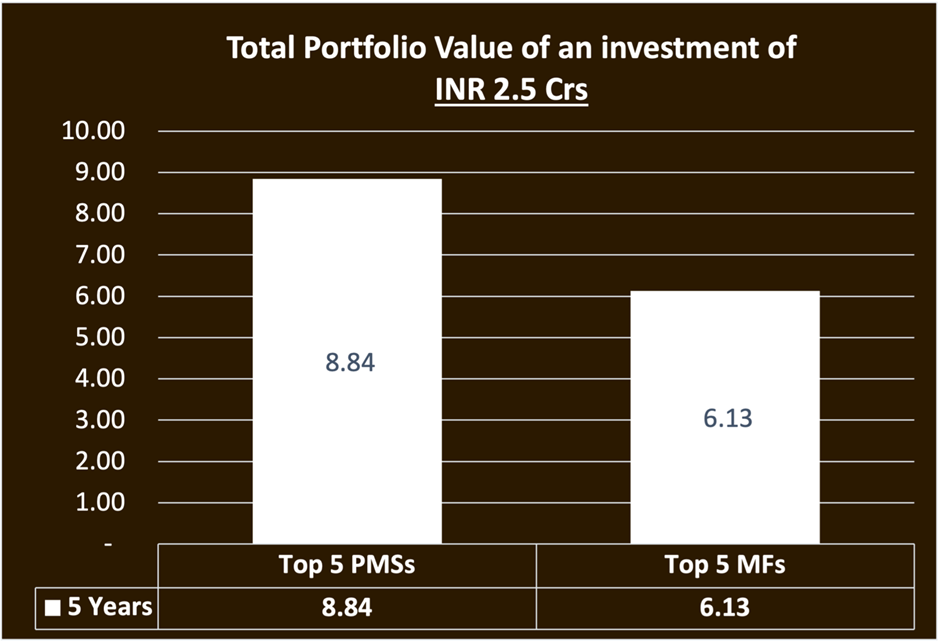
Conclusion: If one had invested Rs 2.5 Crs in these top 5 PMSs on 1st October 2018, rather than in the top 5 MFs, over a period of 5 years, one would have generated Rs 2.72 Crs more.
5Y Returns Comparison – Mid & Small Cap
| TOP 5 PMSs- 5Y Returns (Mid & Small Cap Fund) | ||
| Scheme Name | AuM (Cr) | Annualized Returns |
| Green Lantern Capital LLP Growth Fund | 200.95 | 31.37% |
| Equirus Long Horizon Fund | 896.73 | 29.60% |
| UNIFI APJ 20 | 538.59 | 28.05% |
| UNIFI Blended Fund-Rangoli | 11,012.28 | 25.60% |
| Nine Rivers capital Aurum Small Cap Oppprtunities | 458.00 | 25.59% |
| TOP 5 MFs- 5Y Returns (Regular Plan, Mid & Small Cap Fund) | ||
| Scheme Name | AuM (Cr) | Annualized Returns |
| Quant Small Cap Fund | 9,089.12 | 29.46% |
| Nippon India Small Cap Fund | 37,374.40 | 25.48% |
| Axis Small Cap Fund | 16,175.33 | 24.85% |
| ICICI Prudential Smallcap Fund | 6,054.27 | 24.41% |
| Kotak Small Cap Fund | 12,439.62 | 23.97% |
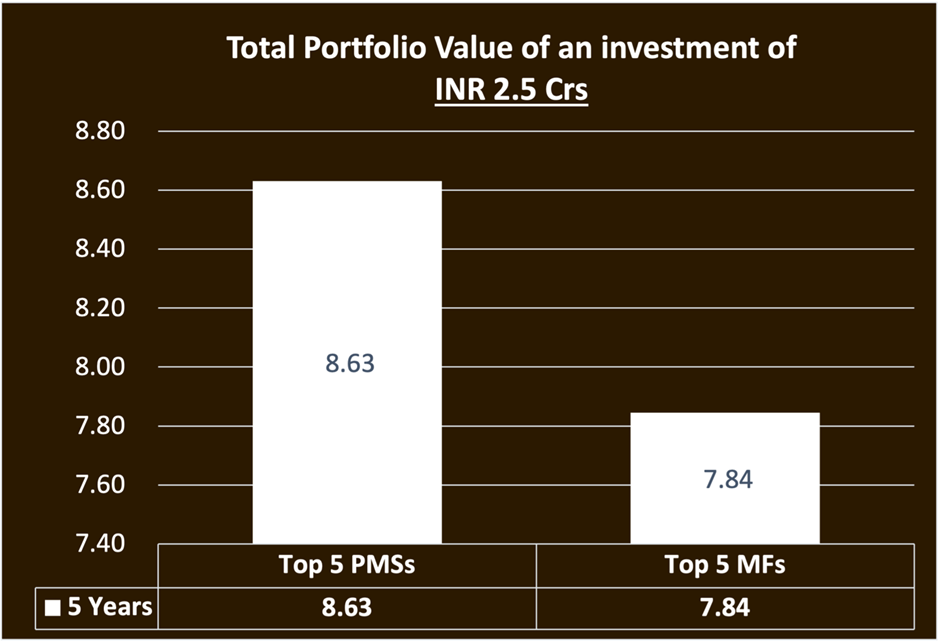
Conclusion: If one had invested Rs 2.5 Crs in these top 5 PMSs on 1st October 2018, rather than in the top 5 MFs, over a period of 5 years, one would have generated Rs 0.79 Crs more.
3Y Returns Comparison – Multi Cap
| TOP 5 PMSs- 3Y Returns (Multi Cap Fund) | ||
| Scheme Name | AuM (Cr) | Annualized Returns |
| Negen Capital Special Situations Fund | 619.63 | 47.69% |
| INVASSET Growth Pro Max PMS | 120.00 | 45.01% |
| Unique Strategic PMS | 1113.75 | 43.92% |
| Buoyant Capital Opportunities Multi-cap | 1393.00 | 42.72% |
| ValueQuest Platinum Scheme | 659.65 | 40.78% |
| TOP 5 MFs- 3Y Returns (Regular Plan, Multi/Flexi Cap Fund) | ||
| Scheme Name | AuM (Cr) | Annualized Returns |
| Nippon India Multi Cap Fund | 20,930.00 | 37.85% |
| HDFC Flexi Cap Fund | 39,794.33 | 33.20% |
| HDFC Large and Mid Cap Fund | 11,810.08 | 31.72% |
| Quant Active Fund | 6,018.00 | 31.56% |
| ICICI Prudential Large & Mid Cap Fund | 9,177.04 | 31.19% |
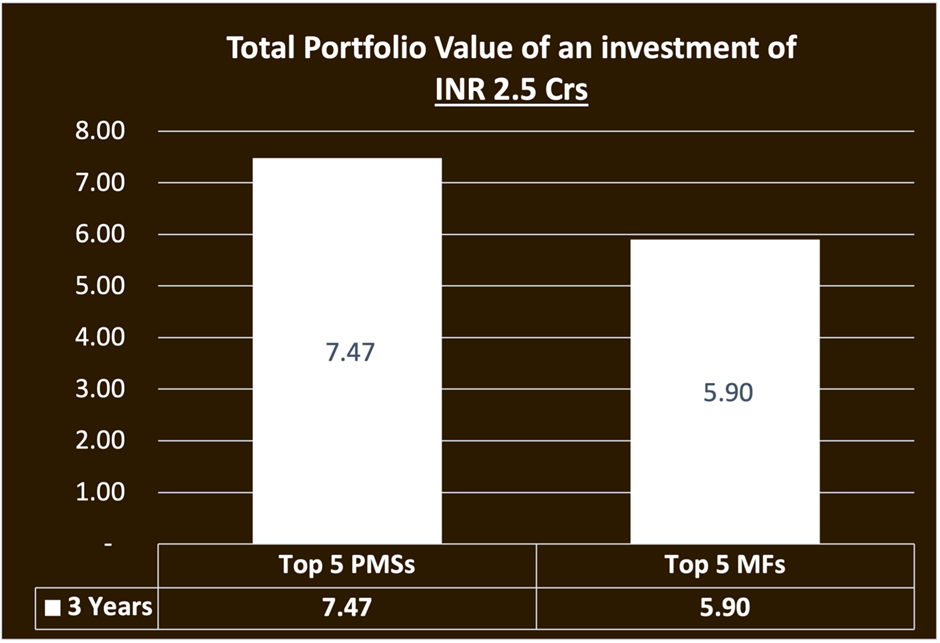
Conclusion: If one had invested Rs 2.5 Crs in these top 5 PMSs on 1st October 2020, rather than in the top 5 MFs, over a period of 3 years, one would have generated Rs 1.57 Crs more.
3Y Returns Comparison – Mid & Small Cap
| TOP 5 PMSs- 3Y Returns (Mid & Small Cap Fund) | ||
| Scheme Name | AuM (Cr) | Annualized Returns |
| Counter Cyclical Diversified Long Term Value PMS | 484.25 | 85.97% |
| Green Lantern Capital LLP Growth Fund | 200.95 | 63.49% |
| Aequitas Investment India Opportunities Product | 2,726.10 | 60.15% |
| Valentis Advisors Rising Star Opportunity Fund | 651.00 | 47.11% |
| Roha Asset Managers Roha- Emerging Champions Portfolio | 396.57 | 44.38% |
| TOP 5 MFs- 3Y Returns (Regular Plan, Mid & Small Cap Fund) | ||
| Scheme Name | AuM (Cr) | Annualized Returns |
| Quant Small Cap Fund | 9,089.12 | 45.16% |
| Nippon India Small Cap Fund | 37,374.40 | 42.76% |
| HSBC Small Cap Fund | 11,650.11 | 40.70% |
| HDFC Small Cap Fund | 23,251.04 | 39.83% |
| Tata Small Cap Fund | 6,134.53 | 38.19% |
Conclusion: If one had invested Rs 2.5 Crs in these top 5 PMSs on 1st October 2020, rather than in the top 5 MFs, over a period of 3 years, one would have generated Rs 3.49 Crs more.
2Y Returns Comparison – Multi Cap
| TOP 5 PMSs- 2Y Returns (Multi Cap Fund) | ||
| Scheme Name | AuM (Cr) | Annualized Returns |
| Unique Strategic PMS | 1113.75 | 30.07% |
| INVAsset Growth Pro Max PMS | 120.00 | 28.80% |
| Samvitti Capital Active Alpha Multicap | 123.82 | 28.41% |
| Globe Capital Value PMS | 443.00 | 22.71% |
| ICICI Prudential PMS Value Strategy | 108.10 | 22.50% |
| TOP 5 MFs- 2Y Returns (Regular Plan, Multi/Flexi Cap Fund) | ||
| Scheme Name | AuM (Cr) | Annualized Returns |
| Nippon India Multi Cap Fund | 20,930.00 | 20.40% |
| HDFC Flexi Cap Fund | 39,794.33 | 16.81% |
| HDFC Large and Mid Cap Fund | 11,810.08 | 15.08% |
| Bandhan Core Equity Fund | 2,944.80 | 14.05% |
| Kotak Multicap Fund | 6,316.00 | 14.05% |
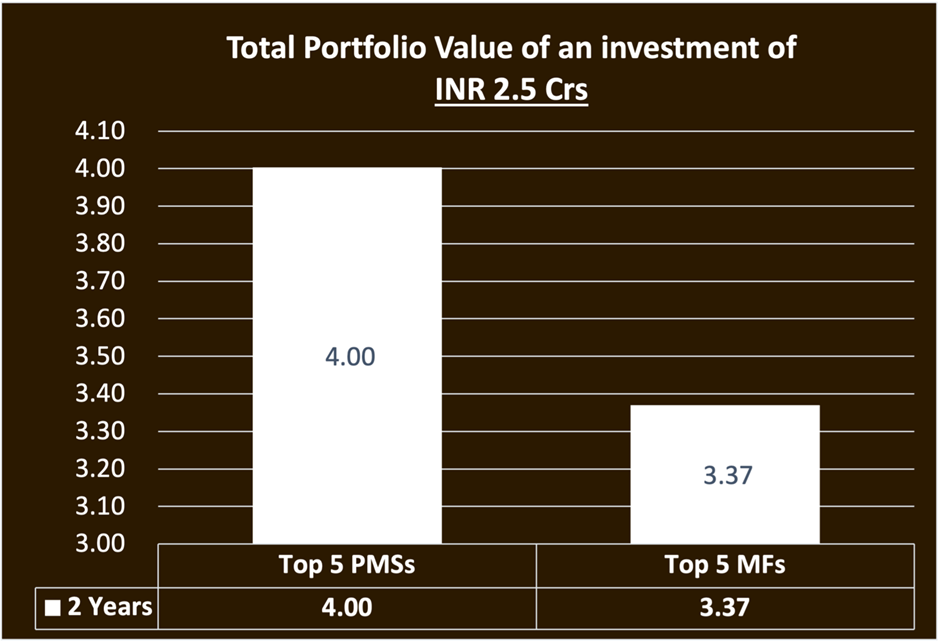
Conclusion: If one had invested Rs 2.5 Crs in these top 5 PMSs on 1st October 2021, rather than in the top 5 MFs, over a period of 2 years, one would have generated Rs 0.63 Crs more.
2Y Returns Comparison – Mid & Small Cap
| TOP 5 PMSs- 2Y Returns (Mid & Small Cap Fund) | ||
| Scheme Name | AuM (Cr) | Annualized Returns |
| Aequitas Investment India Opportunities Product | 2,726.10 | 40.88% |
| Counter Cyclical Diversified Long Term Value PMS | 484.25 | 40.40% |
| Green Lantern Capital LLP Growth Fund | 200.95 | 36.15% |
| Molecule Ventures Growth PMS | 282.32 | 31.62% |
| ithought VRDDHI PMS | 262.00 | 28.30% |
| TOP 5 MFs- 2Y Returns (Regular Plan, Mid & Small Cap Fund) | ||
| Scheme Name | AuM (Cr) | Annualized Returns |
| Nippon India Small Cap Fund | 37,374.40 | 22.95% |
| Motilal Oswal Midcap Fund | 5,953.05 | 22.05% |
| Quant Mid Cap Fund | 3,140.30 | 21.10% |
| HDFC Mid-Cap Opportunities Fund | 48,686.00 | 20.36% |
| HSBC Small Cap Fund | 11,650.11 | 20.09% |
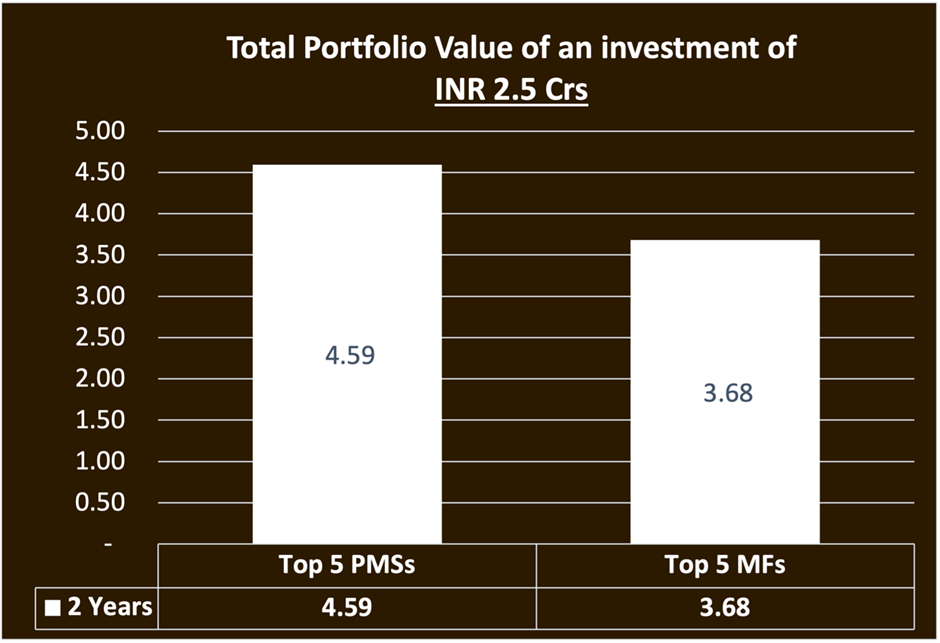
Conclusion: If one had invested Rs 2.5 Crs in these top 5 PMSs on 1st October 2021, rather than in the top 5 MFs, over a period of 2 years, one would have generated Rs 0.91 Crs more.
1Y Returns Comparison – Multi Cap
| TOP 5 PMSs- 1Y Returns (Multi Cap Fund) | ||
| Scheme Name | AuM (Cr) | Annualized Returns |
| Samvitti Capital Active Alpha Multicap | 123.82 | 68.95% |
| Shepherd’s Hill Value Mango PMS | 86.85 | 64.02% |
| INVASSET Growth Pro Max PMS | 120.00 | 63.33% |
| Maximal Pathfinder Value PMS | 82.24 | 57.39% |
| Unique Strategic PMS | 1113.75 | 53.21% |
| TOP 5 MFs- 1Y Returns (Regular Plan, Multi/Flexi Cap Fund) | ||
| Scheme Name | AuM (Cr) | Annualized Returns |
| Motilal Oswal Large and Midcap Fund | 2,337.62 | 30.06% |
| HDFC Multi Cap Fund | 8,834.00 | 29.96% |
| Nippon India Multi Cap Fund | 20,930.00 | 28.98% |
| Kotak Multicap Fund | 6,316.00 | 28.70% |
| HDFC Large and Mid Cap Fund | 11,810.08 | 27.26% |
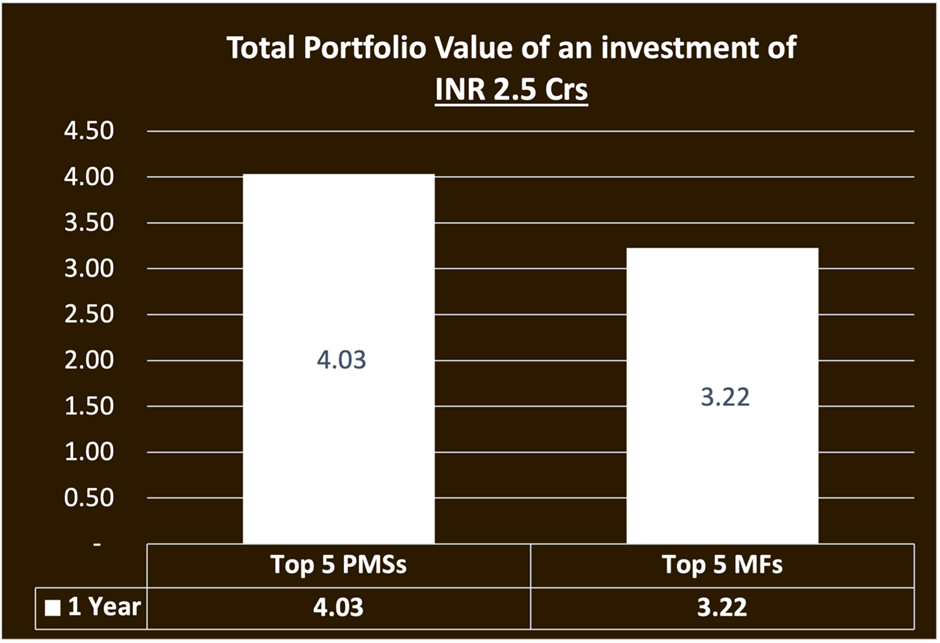
Conclusion: If one had invested Rs 2.5 Crs in these top 5 PMSs on 1st October 2022, rather than in the top 5 MFs, over a period of 1 year, one would have generated Rs 0.81 Crs more.
1Y Returns Comparison – Mid & Small Cap
| TOP 5 PMSs- 1Y Returns (Mid & Small Cap Fund) | ||
| Scheme Name | AuM (Cr) | Annualized Returns |
| Aequitas Investment India Opportunities Product | 2,726.10 | 82.09% |
| ithought VRDDHI PMS | 262.00 | 59.72% |
| Green Lantern Capital LLP Growth Fund | 200.95 | 58.70% |
| Green Portfolio Super 30 | 76.14 | 52.92% |
| Abakkus Asset Manager Emerging Opportunities Approach | 1,422.00 | 50.90% |
| TOP 5 MFs- 1Y Returns (Regular Plan, Mid & Small Cap Fund) | ||
| Scheme Name | AuM (Cr) | Annualized Returns |
| Quant Small Cap Fund | 9,089.12 | 38.09% |
| HDFC Small Cap Fund | 23,251.04 | 38.06% |
| Franklin India Smaller Companies Fund | 9,719.31 | 36.43% |
| Nippon India Small Cap Fund | 37,374.40 | 35.50% |
| HDFC Mid-Cap Opportunities Fund | 48,686.00 | 34.94% |
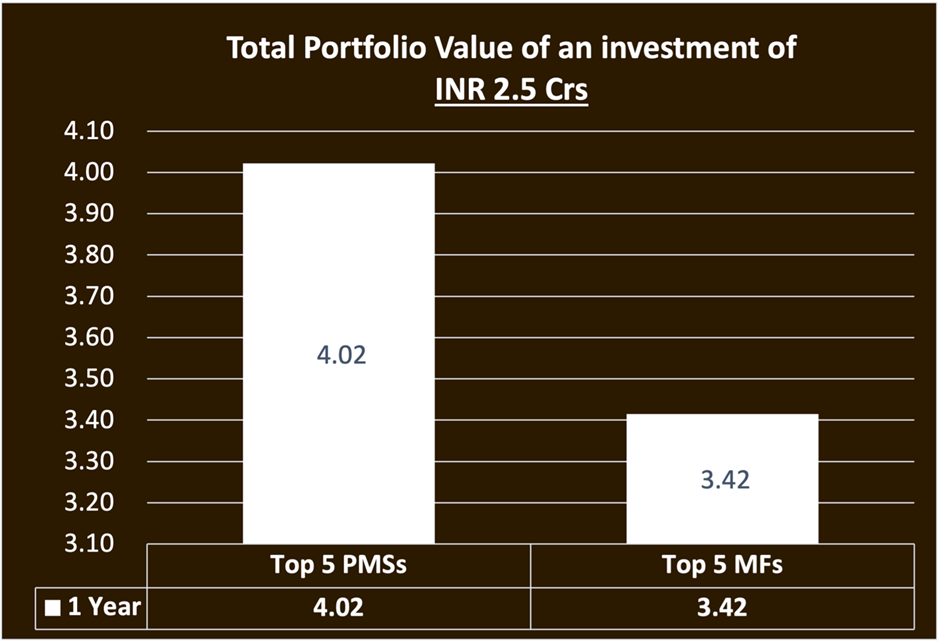
Conclusion: If one had invested Rs 2.5 Crs in these top 5 PMSs on 1st October 2022, rather than in the top 5 MFs, over a period of 1 year, one would have generated Rs 0.61 Crs more.
Wish to make INFORMED INVESTMENTS for Long Term WEALTH CREATION