


Charmi Shah
Content & Analysis,
PMS AIF WORLD
Wealth Management Industry is not designed to be Fair. There are hundreds of products and strategies that waste time and money. A strict discipline is required, and one must practice caution while investing. It is easy to socialize and sell, which is what most sales-driven wealth management companies do. But it is equally difficult to maintain insight and integrity, which is what drives us.
PMS AIF WORLD provides analytics & content backed quality investment services. It is easy to socialize and sell, which is what most sales-driven wealth management companies do. But it is equally difficult to maintain insight and integrity, which is what drives us. Our focus is Performance, and we are driven by meaningful analytics.
We are a new age Wealth Management Company. With us, investors make informed investment decisions.
Here we present a simple analysis to address some real questions asked by investors today – Where should you invest – Portfolio Management Services (PMS) or Mutual Funds (MF)?
While both are well regulated and credible structures meant to out-perform equity market indices, objective performance analysis conveys that it is the PMSs that have generated significantly higher alpha and so, are righty considered to be wealth-creating vehicles.
Which is better – Portfolio Management Services or Mutual Funds?
We have curated a detailed score card to analyse the performance of both. A comparison has been done between MFs and PMSs (data has been considered as of 30.09.2022 for both) and the infographics of the same are given below.
We followed 3 simple steps
Step 1: We filtered Top 5 PMSs and Top 5 Mutual Funds (Open Ended, Regular Plans) in different time periods of 1 Year, 2 Years, 3 Years, 5 Years, and 10 Years from all the options available during these time periods; for all— Annualized Returns have been taken for period ending 30.09.2022.
Also, since 10Y is a good long term horizon, we have not bifurcated the comparison into different market cap categories for 10Y. Thus, for a 10-year period, the comparison has been done across all categories; but for 5Y, 3Y, 2Y, and 1Y comparisons, we bifurcated into Multi Cap comparison as well as Mid & Small Comparisons.
Step 2: To make it simpler, we compared Multi Cap PMSs with Multi/Flexi Cap MFs and we compared Mid & Small Cap PMSs with Mid & Small Cap MFs.
Step 3: We assumed investing INR 2.5 crores in equal weights (i.e. INR 50 lakhs each) in Top 5 PMSs & investing INR 2.5 crores in equal weights (i.e. INR 50 lakhs each) in Top 5 MFs during these time periods and arrived at the following results.
10Y Returns Comparison – Across All Categories
| TOP 5 PMSs- 10Y Returns (Across all categories) | ||
| Scheme Name | AuM (Cr) | Annualized Returns |
| Master Portfolio Services Vallum India Discovery | ₹ 536.61 | 27.80% |
| SageOne Investment Core Portfolio | ₹ 2,220.00 | 26.80% |
| Care PMS Growth Plus Value | ₹ 523.00 | 23.40% |
| AccuraCap PicoPower | ₹ 997.01 | 23.20% |
| Girik Capital Multicap Growth Equity Strategy | ₹ 832.35 | 20.90% |
| TOP 5 MFs- 10Y Returns (Across all categories) | ||
| Scheme Name | AuM (Cr) | Annualized Returns |
| SBI Small Cap Fund | ₹ 14,494.00 | 25.17% |
| Nippon India Small Cap Fund | ₹ 22,158.00 | 24.09% |
| DSP Small Cap Fund | ₹ 9,066.00 | 20.99% |
| SBI Magnum Midcap Fund | ₹ 8,195.00 | 19.88% |
| Kotak Emerging Equity Fund | ₹ 21,996.00 | 19.72% |
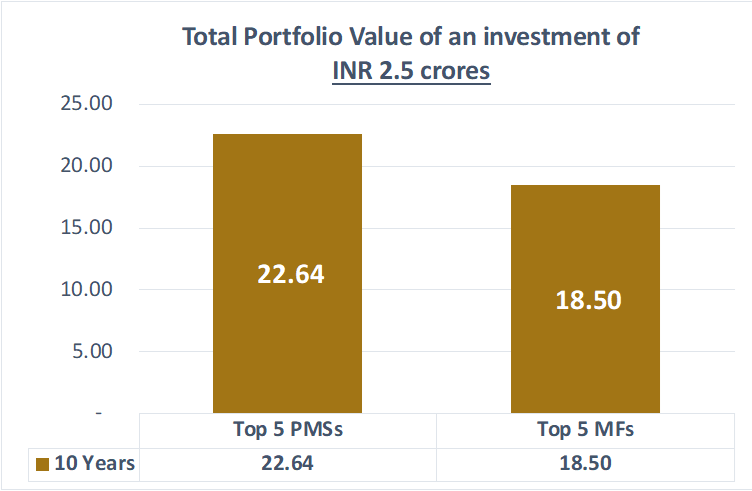
Conclusion: If one had invested Rs 2.5 Crs in these top 5 PMSs on 1st Oct 2012, rather than in the top 5 MFs, over a period of 10 years, one would have generated Rs 4.14 Cr more.
5Y Returns Comparison – Multi Cap
| TOP 5 PMSs- 5Y Returns ( Multi Cap Fund) | ||
| Scheme Name | AuM (Cr) | Annualized Returns |
| Solidarity Advisors Prudence Portfolio | ₹ 1,423.32 | 20.83% |
| ValueQuest Investment Advisors Platinum Scheme | ₹ 339.86 | 20.60% |
| Sameeksha Capital Equity Fund | ₹ 582.78 | 18.20% |
| Ambit Capital Coffee CAN | ₹ 1,021.96 | 17.90% |
| SBI Funds Management ESG Portfolio | ₹ 358.36 | 17.70% |
| TOP 5 MFs- 5Y Returns (Regular Plan, Multi/Flexi Cap Fund) | ||
| Scheme Name | AuM (Cr) | Annualized Returns |
| Parag Parikh Flexi Cap Fund | ₹ 26,033.00 | 16.21% |
| PGIM India Flexi Cap Fund | ₹ 5,085.00 | 14.36% |
| UTI Flexi Cap Fund | ₹ 25,787.00 | 14.30% |
| SBI Focused Equity Fund | ₹ 27,607.00 | 14.12% |
| Nippon India Multi Cap Fund | ₹ 13,529.00 | 13.61% |
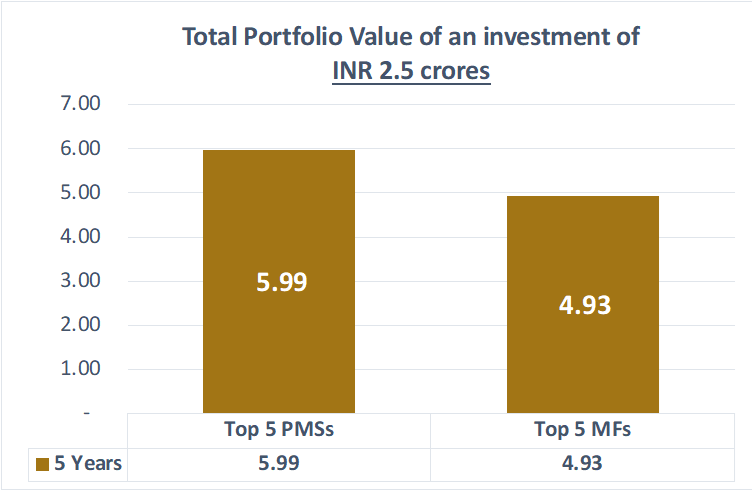 Conclusion: If one had invested Rs 2.5 Crs in these top 5 PMSs on 1st Oct 2017, rather than in the top 5 MFs, over a period of 5 years, one would have generated Rs 1.06 Cr more.
5Y Returns Comparison – Mid & Small Cap
| TOP 5 PMSs- 5Y Returns (Mid & Small Cap Fund) | ||
| Scheme Name | AuM (Cr) | Annualized Returns |
| Equirus Wealth Long Horizon Fund | ₹ 602.57 | 22.70% |
| UNIFI Capital Blended Fund-Rangoli | ₹ 8,000.00 | 21.00% |
| UNIFI Capital Insider Shadow | ₹ 686.32 | 20.86% |
| Valentis Advisors Rising Star Opportunity Fund | ₹ 266.89 | 18.80% |
| UNIFI Capital APJ 20 | ₹ 471.21 | 17.60% |
| TOP 5 MFs- 5Y Returns (Regular Plan, Mid & Small Cap Fund) | ||
| Scheme Name | AuM (Cr) | Annualized Returns |
| Axis Small Cap Fund | ₹ 10,761.00 | 19.73% |
| PGIM India Midcap Opportunities Fund | ₹ 6,954.00 | 19.05% |
| Nippon India Small Cap Fund | ₹ 22,158.00 | 18.35% |
| SBI Small Cap Fund | ₹ 14,494.00 | 18.03% |
| Kotak Small Cap Fund | ₹ 8,469.00 | 17.79% |
 Conclusion: If one had invested Rs 2.5 Crs in these top 5 PMSs on 1st Oct 2017, rather than in the top 5 MFs, over a period of 5 years, one would have generated Rs 0.42 Cr more.
3Y Returns Comparison – Multi Cap
| TOP 5 PMSs- 3Y Returns (Multi Cap Fund) | ||
| Scheme Name | AuM (Cr) | Annualized Returns |
| Negen Capital Special Situations & Technology Fund | ₹ 413.96 | 39.40% |
| ValueQuest Investment Advisors Platinum Scheme | ₹ 339.86 | 36.80% |
| Itus Capital Fundamental Value Fund | ₹ 781.69 | 34.50% |
| ValueQuest Investment Advisors Growth Scheme | ₹ 752.38 | 32.20% |
| Wizemarkets Analytics Capitalmind Momentum | ₹ 479.16 | 30.10% |
| TOP 5 MFs- 3Y Returns (Regular Plan, Multi/Flexi Cap Fund) | ||
| Scheme Name | AuM (Cr) | Annualized Returns |
| PGIM India Flexi Cap Fund | ₹ 5,085.00 | 23.55% |
| Parag Parikh Flexi Cap Fund | ₹ 26,033.00 | 22.69% |
| Nippon India Focused Equity Fund | ₹ 6,039.00 | 21.42% |
| Nippon India Multi Cap Fund | ₹ 13,529.00 | 20.94% |
| Franklin India Focused Equity Fund | ₹ 8,072.00 | 20.20% |
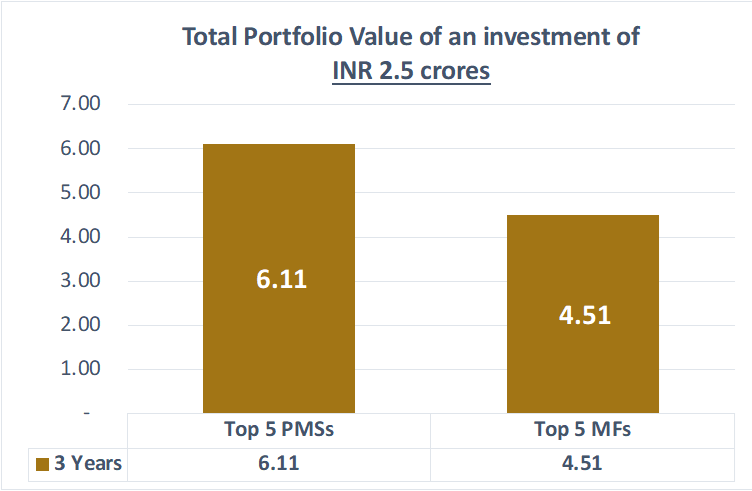 Conclusion: If one had invested Rs 2.5 Crs in these top 5 PMSs on 1st Oct 2019, rather than in the top 5 MFs, over a period of 3 years, one would have generated Rs 1.59 Cr more.
3Y Returns Comparison – Mid & Small Cap
| TOP 5 PMSs- 3Y Returns (Mid & Small Cap Fund) | ||
| Scheme Name | AuM (Cr) | Annualized Returns |
| Counter Cyclical Diversified Long Term Value | ₹ 229.87 | 83.56% |
| SageOne Investment Small Cap Portfolio (SSP) | ₹ 890.00 | 41.00% |
| UNIFI Capital APJ 20 | ₹ 471.21 | 40.27% |
| Valentis Advisors Rising Star Opportunity Fund | ₹ 266.89 | 38.20% |
| Equirus Long Horizon Fund | ₹ 602.57 | 37.70% |
| TOP 5 MFs- 3Y Returns (Regular Plan, Mid & Small Cap Fund) | ||
| Scheme Name | AuM (Cr) | Annualized Returns |
| Canara Robeco Small Cap Fund | ₹ 3,767.00 | 38.67% |
| PGIM India Midcap Opportunities Fund | ₹ 6,954.00 | 38.10% |
| Nippon India Small Cap Fund | ₹ 22,158.00 | 34.83% |
| Kotak Small Cap Fund | ₹ 8,469.00 | 33.69% |
| DSP Small Cap Fund | ₹ 9,066.00 | 30.90% |
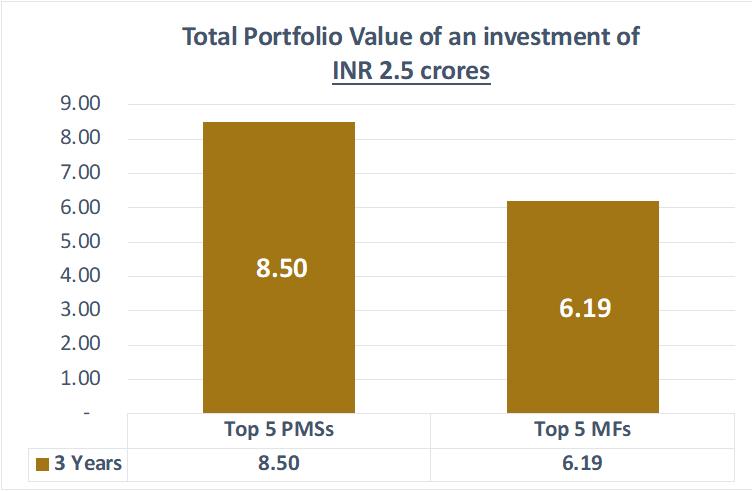 Conclusion: If one had invested Rs 2.5 Crs in these top 5 PMSs on 1st Oct 2019, rather than in the top 5 MFs, over a period of 3 years, one would have generated Rs 2.31 Cr more.
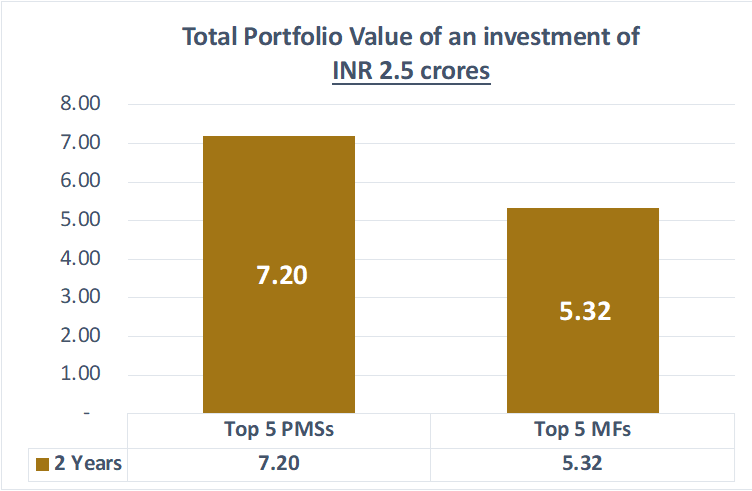
2Y Returns Comparison – Multi Cap
| TOP 5 PMSs- 2Y Returns (Multi Cap Fund) | ||
| Scheme Name | AuM (Cr) | Annualized Returns |
| Negen Capital Special Situations & Technology Fund | ₹ 413.96 | 59.60% |
| Buoyant Capital Opportunities Multi-cap | ₹ 536.00 | 45.70% |
| Green Portfolio Special | ₹ 190.71 | 43.00% |
| SBI Funds Management ESG Portfolio | ₹ 358.36 | 43.00% |
| Avestha Fund Management Growth PMS | ₹ 406.34 | 42.50% |
| TOP 5 MFs- 2Y Returns (Regular Plan, Multi/Flexi Cap Fund) | ||
| Scheme Name | AuM (Cr) | Annualized Returns |
| Nippon India Multi Cap Fund | ₹ 13,529.00 | 42.45% |
| Quant Flexi Cap Fund | ₹ 640.00 | 40.75% |
| Quant Active Fund | ₹ 3,024.00 | 39.36% |
| HDFC Focused 30 Fund | ₹ 2,329.00 | 38.15% |
| Franklin India Focused Equity Fund | ₹ 8,072.00 | 37.73% |
 Conclusion: If one had invested Rs 2.5 Crs in these top 5 PMSs on 1st Oct 2020, rather than in the top 5 MFs, over a period of 2 years, one would have generated Rs 0.52 Cr more.
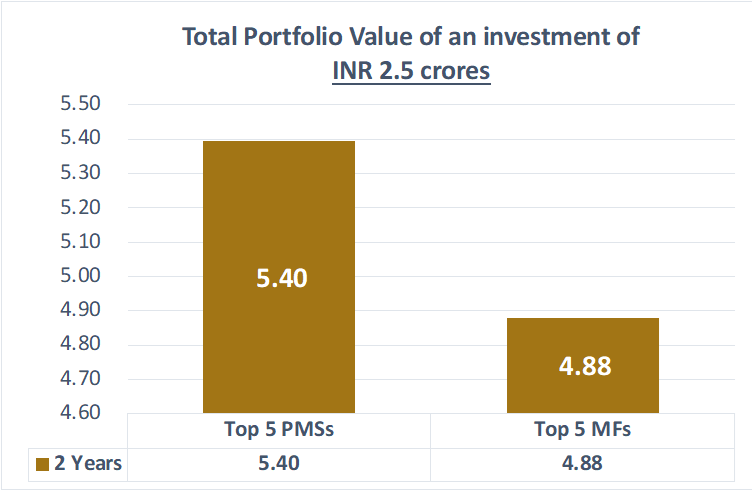
2Y Returns Comparison – Mid & Small Cap
| TOP 5 PMSs- 2Y Returns (Mid & Small Cap Fund) | ||
| Scheme Name | AuM (Cr) | Annualized Returns |
| Counter Cyclical Diversified Long Term Value | ₹ 229.87 | 105.60% |
| Green Lantern Capital Growth Fund | ₹ 56.24 | 65.91% |
| Green Portfolio Super 30 | ₹ 15.67 | 61.70% |
| Right Horizons Minerva Under Served | ₹ 53.10 | 55.20% |
| Equitree Emerghing Opportunities | ₹ 66.23 | 54.51% |
| TOP 5 MFs- 2Y Returns (Regular Plan, Mid & Small Cap Fund) | ||
| Scheme Name | AuM (Cr) | Annualized Returns |
| Quant Small Cap Fund | ₹ 2,207.00 | 48.83% |
| Nippon India Small Cap Fund | ₹ 22,158.00 | 46.53% |
| L&T Emerging Businesses Fund | ₹ 8,406.00 | 45.08% |
| Canara Robeco Small Cap Fund | ₹ 3,767.00 | 44.88% |
| Kotak Small Cap Fund | ₹ 8,469.00 | 43.88% |
 Conclusion: If one had invested Rs 2.5 Crs in these top 5 PMSs on 1st Oct 2020, rather than in the top 5 MFs, over a period of 2 years, one would have generated Rs 1.88 Cr more.
1Y Returns Comparison – Multi Cap
| TOP 5 PMSs- 1Y Returns (Multi Cap Fund) | ||
| Scheme Name | AuM (Cr) | Annualized Returns |
| Avestha Fund Management Growth PMS | ₹ 406.00 | 17.60% |
| Green Portfolio MNC Advantage Fund | ₹ 13.59 | 14.50% |
| SBI Funds Management ESG Portfolio | ₹ 358.36 | 13.20% |
| Turtle Wealth 212 Growth Mantra Fund | – | 13.16% |
| PGIM India Core Equity Portfolio | ₹ 120.38 | 12.90% |
| TOP 5 MFs- 1Y Returns (Regular Plan, Multi/Flexi Cap Fund) | ||
| Scheme Name | AuM (Cr) | Annualized Returns |
| HDFC Focused 30 Fund | ₹ 2,329.00 | 15.91% |
| Nippon India Multi Cap Fund | ₹ 13,529.00 | 12.27% |
| ICICI Prudential Retirement Fund – Pure Equity Plan | ₹ 191.00 | 9.95% |
| HDFC Flexi Cap Fund | ₹ 29,749.00 | 8.85% |
| Quant Active Fund | ₹ 3,024.00 | 7.63% |
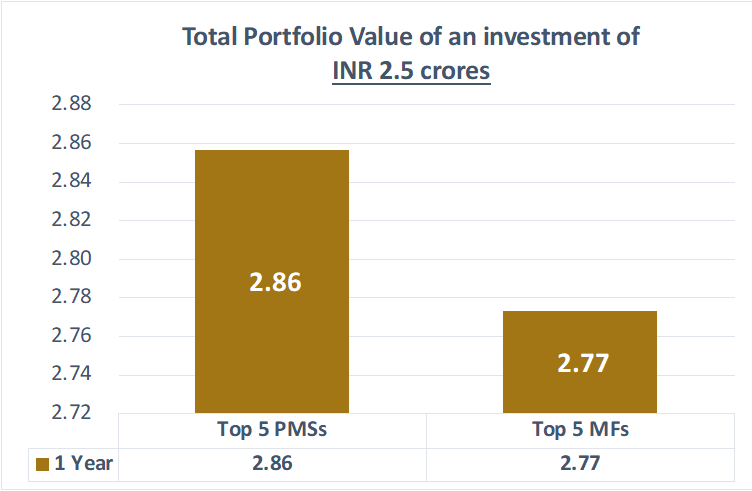 Conclusion: If one had invested Rs 2.5 Crs in these top 5 PMSs on 1st Oct 2021, rather than in the top 5 MFs, over a period of 1 year, one would have generated Rs 0.08 Cr more.
1Y Returns Comparison – Mid & Small Cap
| TOP 5 PMSs- 1Y Returns (Mid & Small Cap Fund) | ||
| Scheme Name | AuM (Cr) | Annualized Returns |
| Counter Cyclical Diversified Long Term Value | ₹ 229.87 | 29.63% |
| Molecule Ventures Growth PMS | ₹ 165.08 | 26.27% |
| Fort Capital Value Fund | ₹ 7.83 | 25.37% |
| Renaissance Investment Managers Mid Cap Portfolio | ₹ 46.10 | 18.77% |
| Green Lantern Capital Growth Fund | ₹ 56.24 | 16.75% |
| TOP 5 MFs- 1Y Returns (Regular Plan, Mid & Small Cap Fund) | ||
| Scheme Name | AuM (Cr) | Annualized Returns |
| Motilal Oswal Midcap Fund | ₹ 3,409.00 | 22.92% |
| Quant Mid Cap Fund | ₹ 862.00 | 15.92% |
| SBI Small Cap Fund | ₹ 14,494.00 | 13.08% |
| SBI Magnum Midcap Fund | ₹ 8,195.00 | 12.41% |
| IDBI Small Cap Fund | ₹ 154.00 | 11.95% |
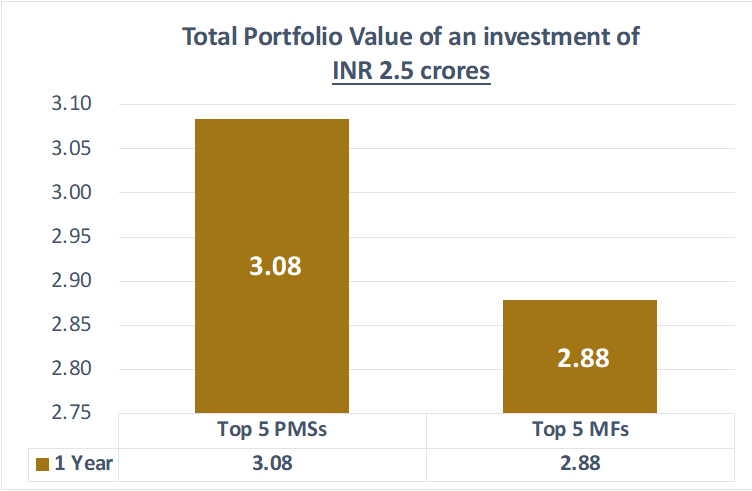 Conclusion: If one had invested Rs 2.5 Crs in these top 5 PMSs on 1st Oct 2021, rather than in the top 5 MFs, over a period of 1 year, one would have generated Rs 0.21 Cr more.
From the above results, it is clear that investing in PMSs has created more wealth for investors than investing in MFs.
This was simple. The difficult task starts from here on. And, that is –
- How to select the potential Best 5 Portfolios for different periods of 3 to 5 years of future investments?
- How to have the conviction to hold the best ones for the longer term?
And, this is best endeavored by our Analytics & Content backed approach.
Our proprietary analysis & content helps tackle the above 2 tasks. We are very selective, and we analyze PMS products across the 5 Ps – People, Philosophy, Performance, Portfolio, and Price with an aim to ascertain the Quality, Risk, and Consistency (QRC) attributes before suggesting the same to investors.
Holding on to the good equity investments requires high conviction in the portfolio at all points of time, else, one tends to exit early owing to the traps of emotions or impatience. With our proprietary content via fund manager videos, newsletters, and articles, we keep our clients updated, and this ensures our clients always make informed decisions.
We offer responsible, long-term quality investing. Our Philosophy is simple, but not easy –
Quality + High Conviction = Compounding.
For any queries related to your investment needs, book an appointment with our experts.
This analytics is an endeavor to compare MFs and PMSs objectively.
Please Note:
- Min AUM taken for PMSs (3Y, 5Y, and 10Y Category) is Rs 200 Crs
- Min AUM taken for MFs (3Y, 5Y, and 10Y Category) is Rs 3250 Crs
- No AUM criteria for 1Y and 2Y categories.
Source: Respective PMS Companies’ Audited Factsheets for PMS Data and Value Research P2P Data for MF Data.Returns more than 1 year is CAGR. These are Point-to-Point returns till 30th September 2022. So, for 10Y, the period taken is 01st October 2012 to 30th September 2022 and likewise for others as well.
RISK DISCLAIMER: Investments are subject to market-related risks. This write up is meant for general information purposes and not to be construed as any recommendation or advice. The investor must make their own analysis and decision depending upon risk appetite. Only those investors who have an aptitude and attitude to risk should consider the space of Alternates (PMS & AIFs). Past Performance may or may not be sustained in the future and should not be used as a basis for comparison with other investments. Please read the disclosure documents carefully before investing. PMS & AIF products are market-linked and do not offer any guaranteed/assured returns. These are riskier investments, with a risk to principal amount as well. Thus, investors must make informed decisions. It is necessary to deep dive not only into the performance, but also into people, philosophy, portfolio, and price, before investing. We, at PMS AIF WORLD do such a detailed 5 P analysis.
Wish to make INFORMED INVESTMENTS for Long Term WEALTH CREATION

