


Charmi Shah
Content & Analysis,
PMS AIF WORLD
Wealth Management Industry is not designed to be Fair. It is easy to socialize and sell, which is what most sales-driven wealth management companies do. But it is equally difficult to maintain insight and integrity, which is what drives us.
PMS AIF WORLD provides analytics & content backed quality investment services. Our focus is Performance, and we are driven by meaningful analytics. We are a new age Wealth Management Company. With us, investors make informed investment decisions.
2 years ago, in June 2020, we presented a similar score card- A Score Card comparing MFs Vs PMSs in terms of Performance. Here is the link to that article.
As euphoric times for equities come to end, investors have become more cautious again, and the question again comes in the minds of investors- Where should one invest – Portfolio Management Services (PMSs) or Mutual Funds (MFs)?
So, we did some analysis again, and here we present the results…
While both are well regulated and credible structures meant to out-perform equity market indices, objective performance analysis conveys that it is the PMSs that have generated significantly higher alpha and so, are righty considered to be wealth-creating vehicles.
We have curated a detailed score card to analyse the performance of both. A comparison has been done between MFs and PMSs (data has been considered as of 30.04.2022 for both) and the infographics of the same are given below.
We followed 3 simple steps
Step 1: We filtered Top 5 Mutual Funds (Open-Ended, Regular Plans) and Top 5 PMSs in different time periods of 1 Year, 2 Years, 3 Years, 5 Years, and 10 Years from all the options available during these time periods; for all— Annualized Returns have been taken for period ending 30.04.2022.
(Min AUM Criteria taken for MFs is AUM > Rs 3000 Cr, and for PMS > Rs 200 Cr)
Step 2: To make it simpler & meaningful, we combined Large, Multi, Small, Mid categories for 10 year performance comparison as we understand, in real long term, only performance matters. But, for 5, 3, 2, 1 year comparison, we have compared Multi/Flexi Cap MFs with Multi Cap PMSs and we compared Mid & Small Cap MFs with Mid & Small Cap PMSs.
Step 3: We assumed investing INR 2.5 crores in equal weights (i.e. INR 50 lakhs each) in Top 5 MFs & investing INR 2.5 crores in equal weights (i.e. INR 50 lakhs each) in Top 5 PMS products during these time periods and arrived at the following results.
10Y Returns Comparison – Across All categories
 For a period as long as 10Y, investors are generally indifferent towards market cap allocation, hence, for this period, we compared the PMSs & MFs across all categories & it was observed that if one had invested Rs 2.5 crs in these top 5 PMSs on 1st May 2012, rather than in the top 5 MFs, over a period of 10 years, one would have generated Rs 7.67 Cr more.
5Y Returns Comparison – Multi Cap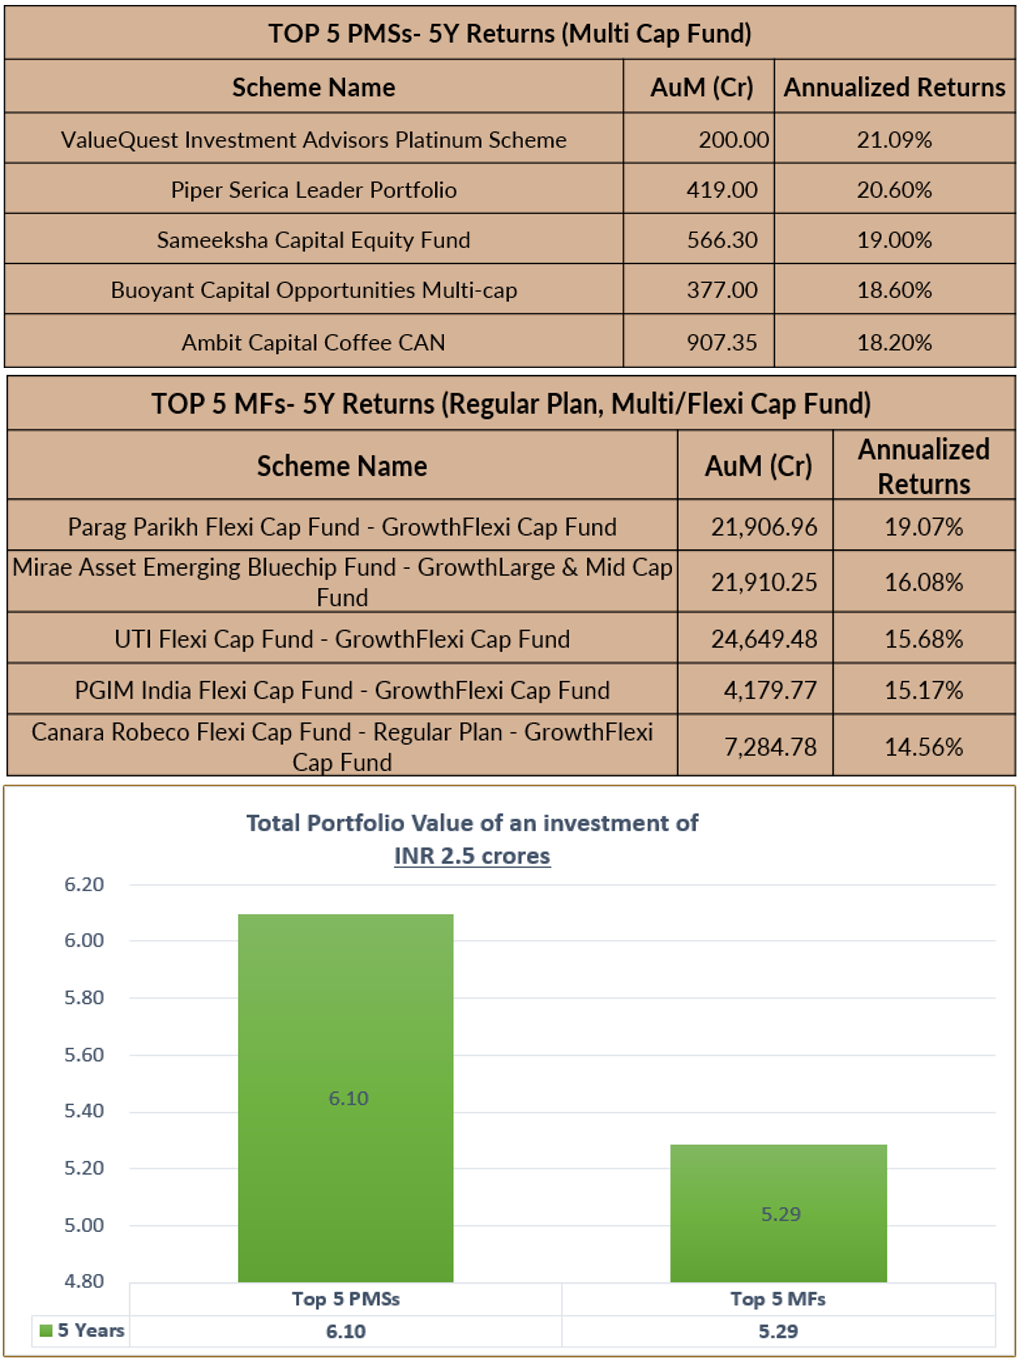
Conclusion: If one had invested Rs 2.5 Crs in these top 5 Multi Cap PMSs on 1st May 2017, rather than in the top 5 MFs, over a period of 5 years, one would have generated Rs 0.81 Cr more.
5Y Returns Comparison – Mid & Small Cap
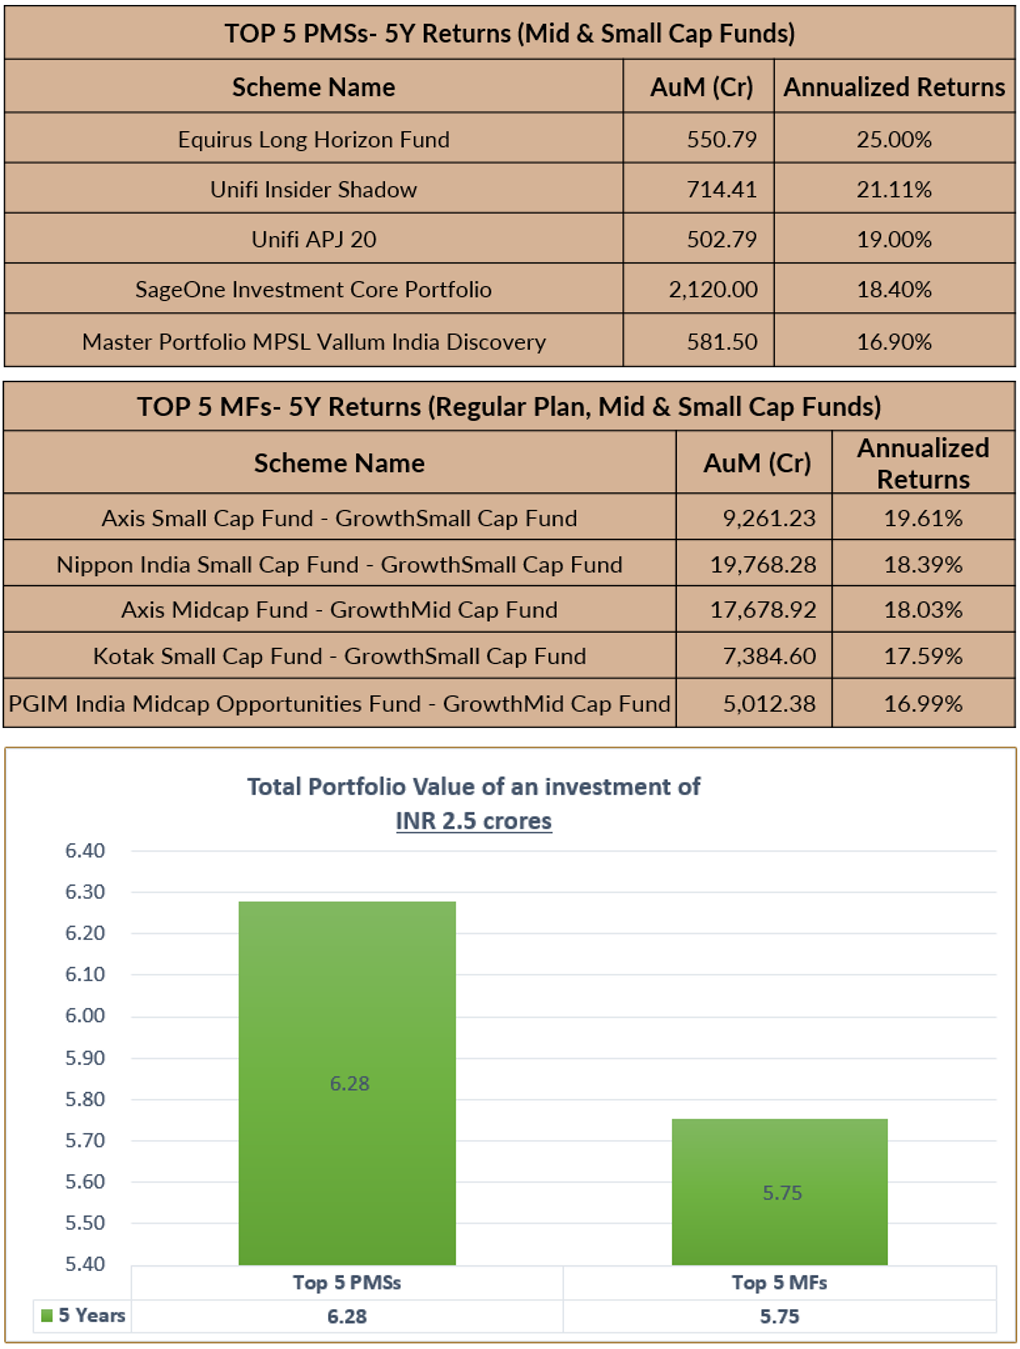 Conclusion: If one had invested Rs 2.5 Crs in these top 5 Mid & Small Cap PMSs on 1st May 2017, rather than in the top 5 MFs, over a period of 5 years, one would have generated Rs 0.52 Cr more.
3Y Returns Comparison- Multi Cap
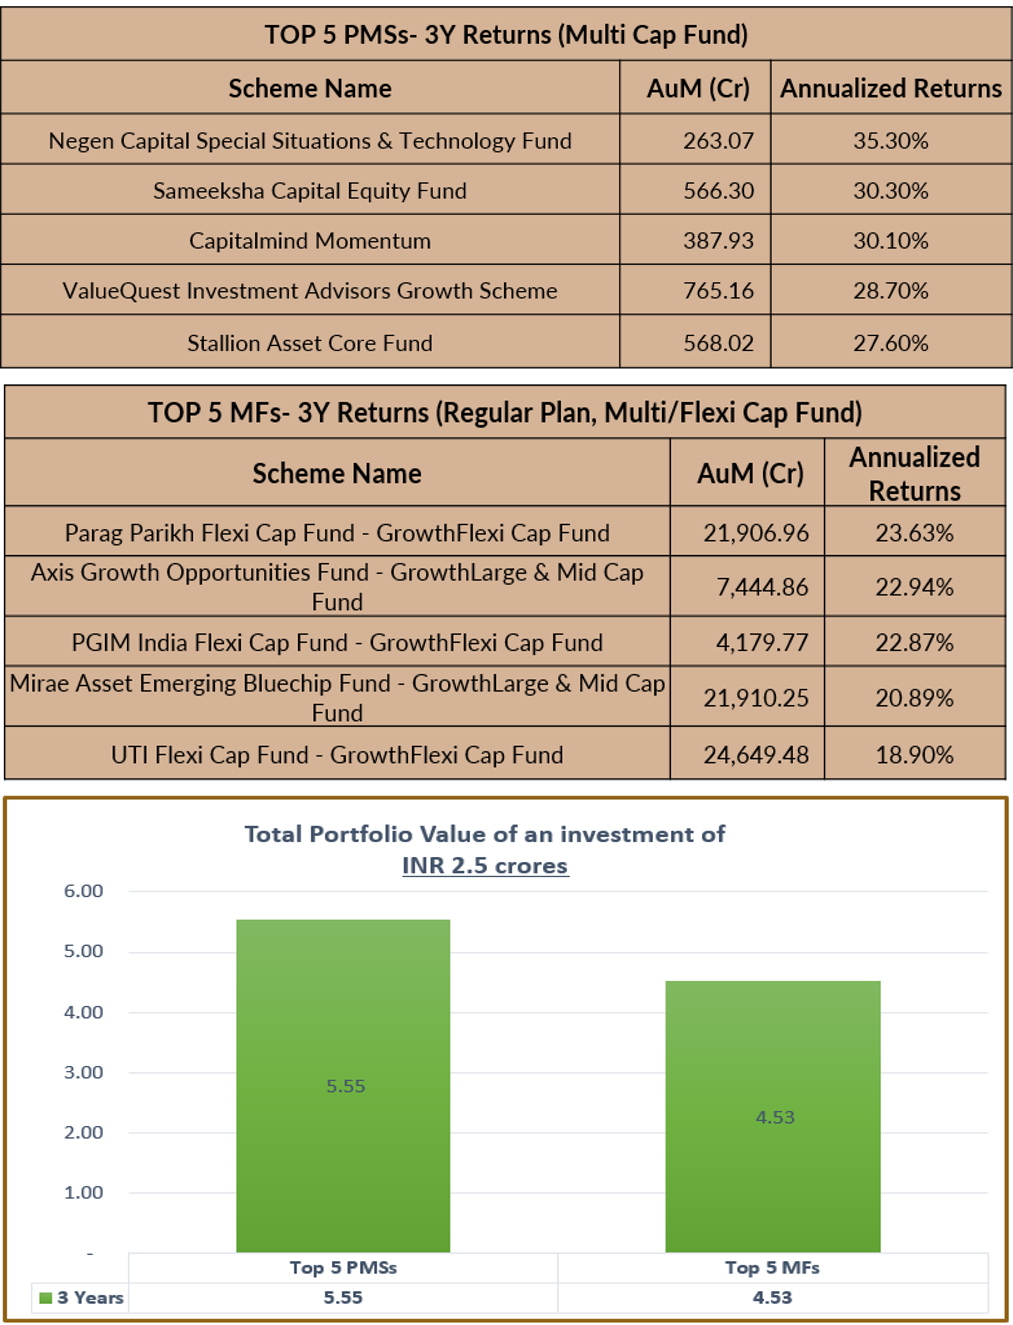 Conclusion: If one had invested Rs 2.5 Crs in these top 5 Multi Cap PMSs on 1st May 2019, rather than in the top 5 MFs, over a period of 3 years, one would have generated Rs 1.02 Cr more.
3Y Returns Comparison – Mid & Small Cap
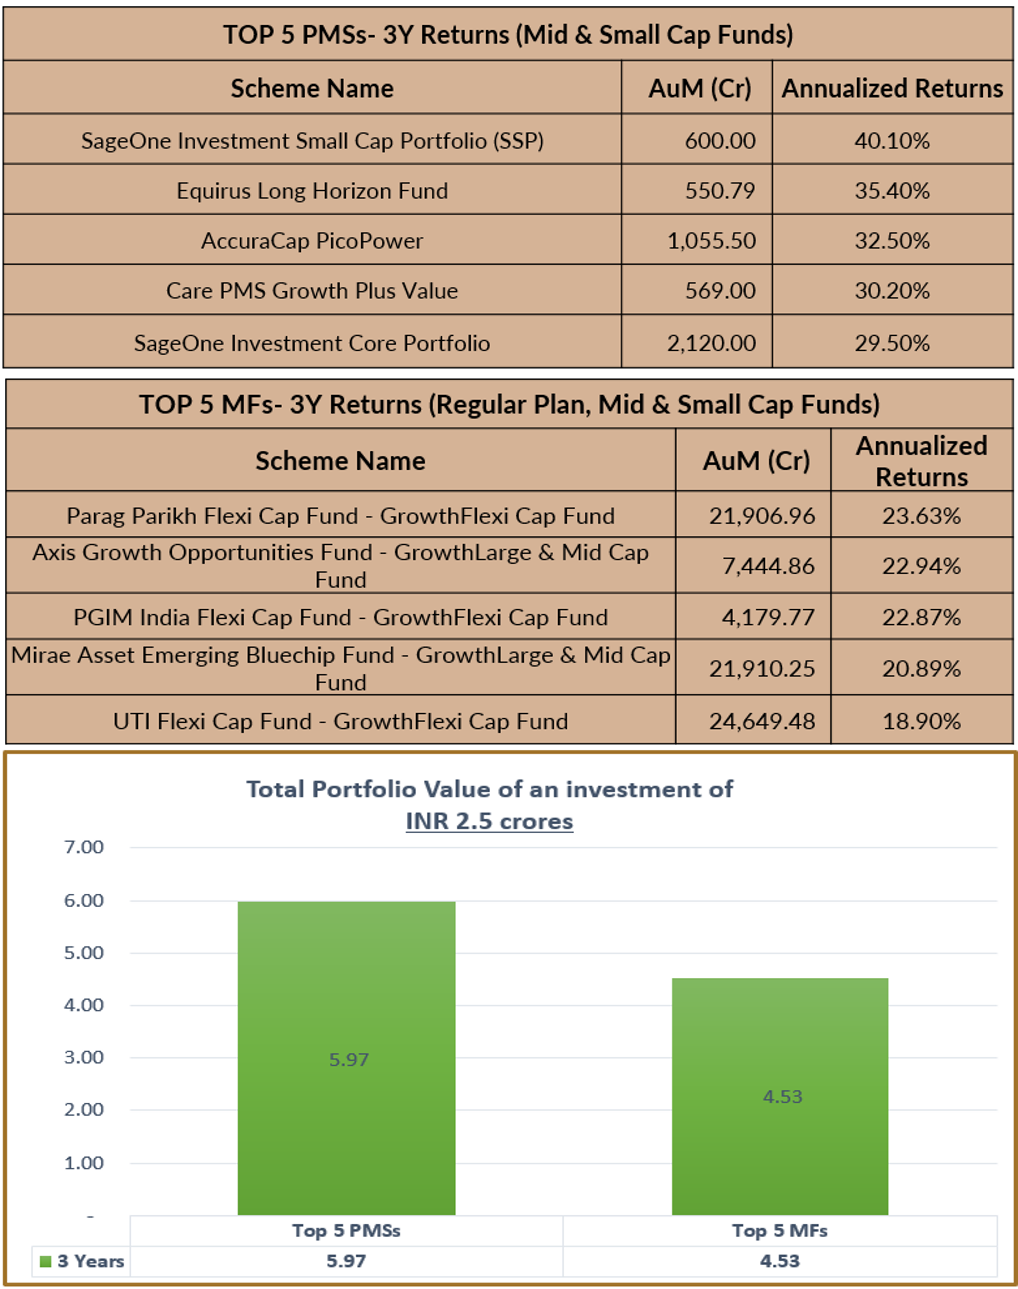
Conclusion: If one had invested Rs 2.5 Crs in these top 5 Mid & Small Cap PMSs on 1st May 2019, rather than in the top 5 MFs, over a period of 3 years, one would have generated Rs 1.44 Cr more.
2Y Returns Comparison – Multi Cap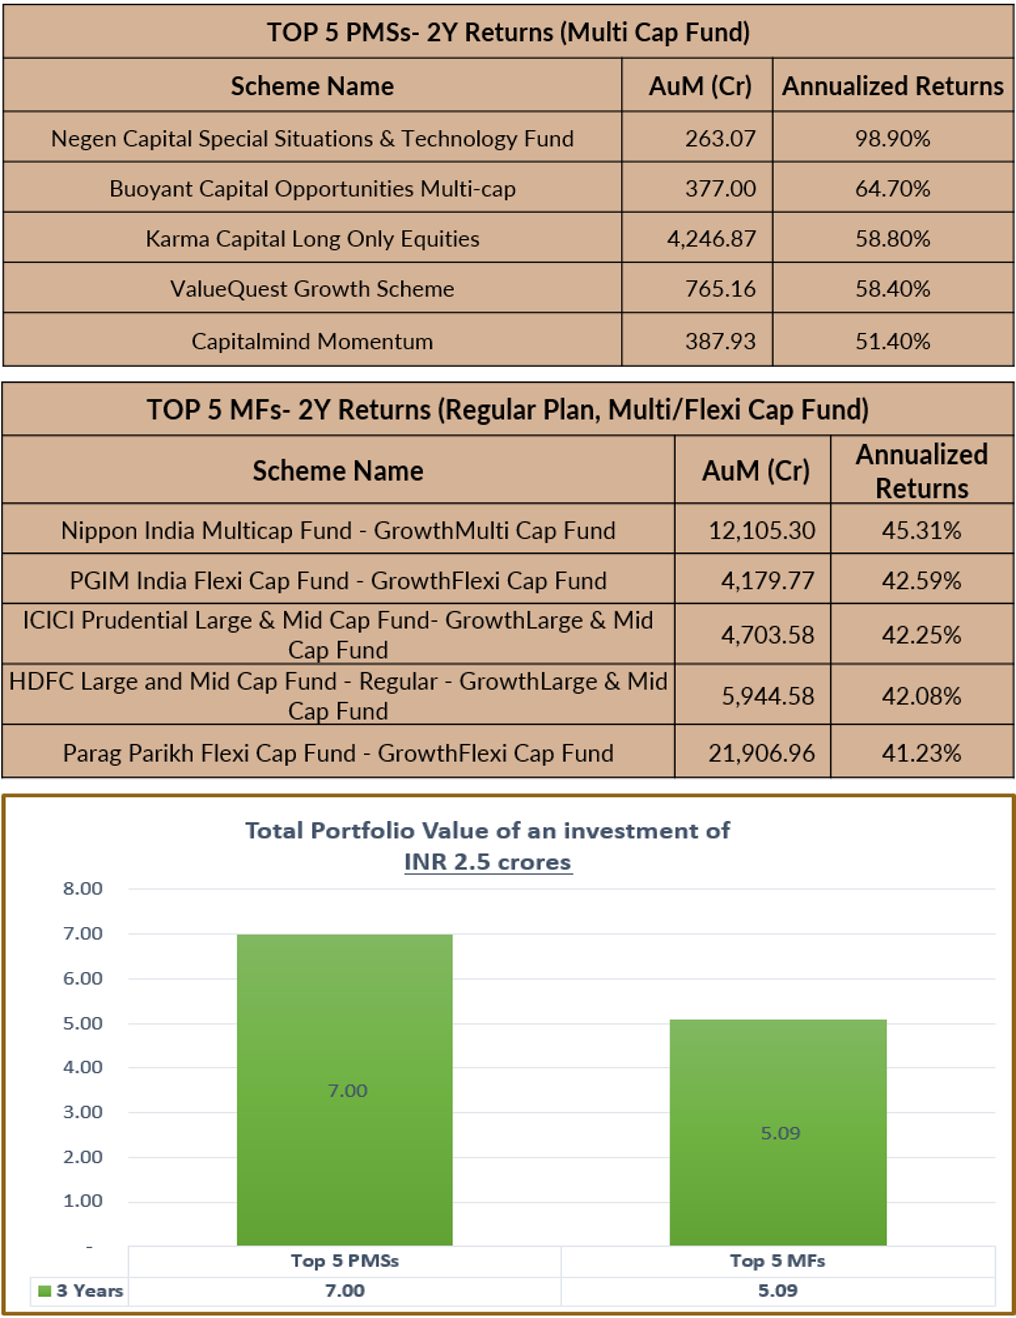
Conclusion: If one had invested Rs 2.5 Crs in these top 5 Multi Cap PMSs on 1st May 2020, rather than in the top 5 MFs, over a period of 2 years, one would have generated Rs 1.91 Cr more.
2Y Returns Comparison – Mid & Small Cap
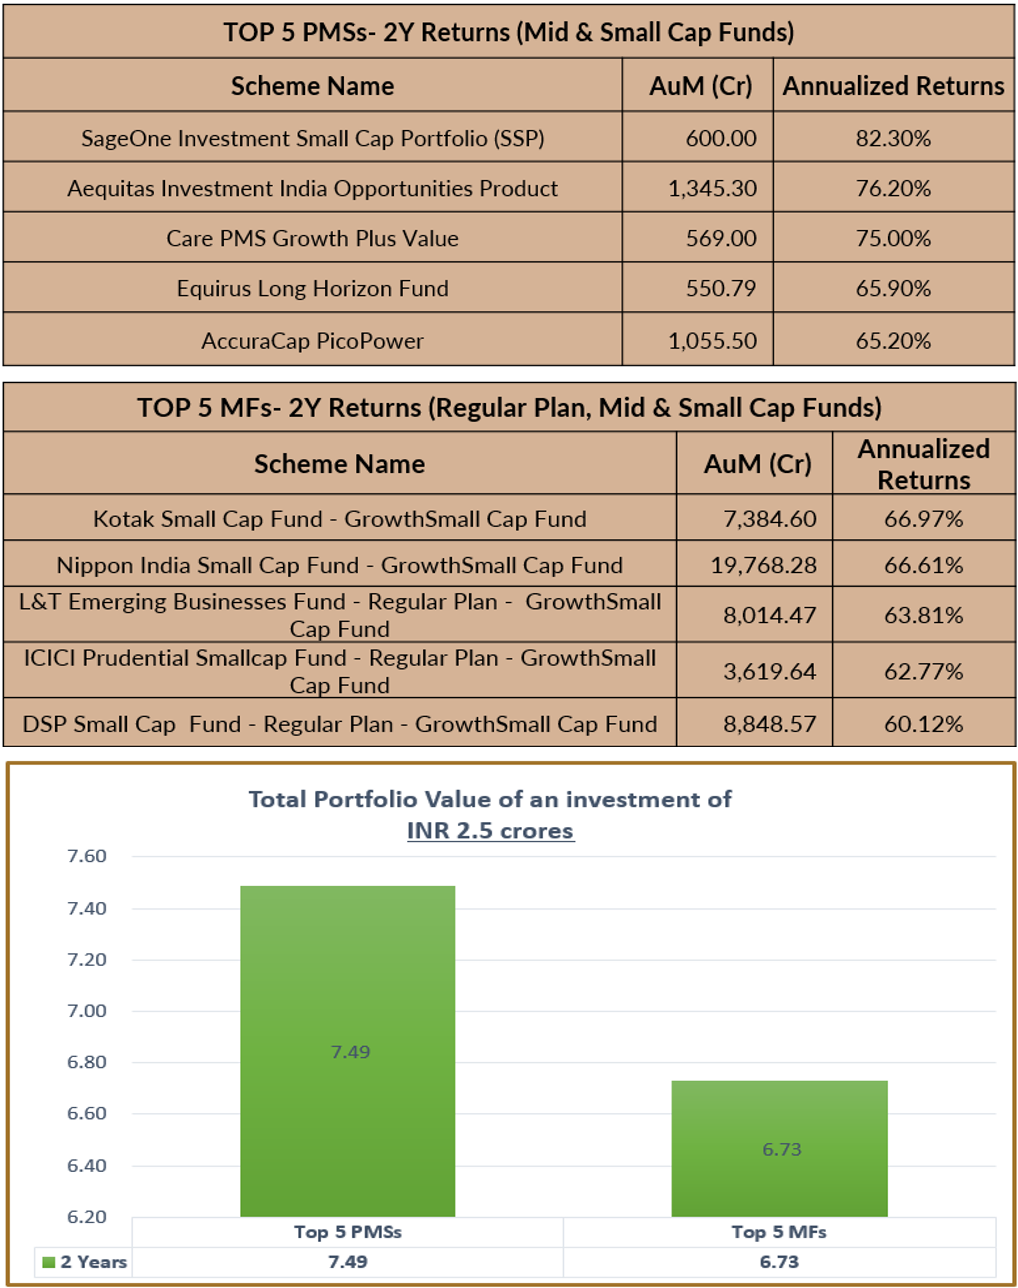 Conclusion: If one had invested Rs 2.5 Crs in these top 5 Mid & Small Cap PMSs on 1st May 2020, rather than in the top 5 MFs, over a period of 2 years, one would have generated Rs 0.76 Cr more.
1Y Returns Comparison – Multi Cap
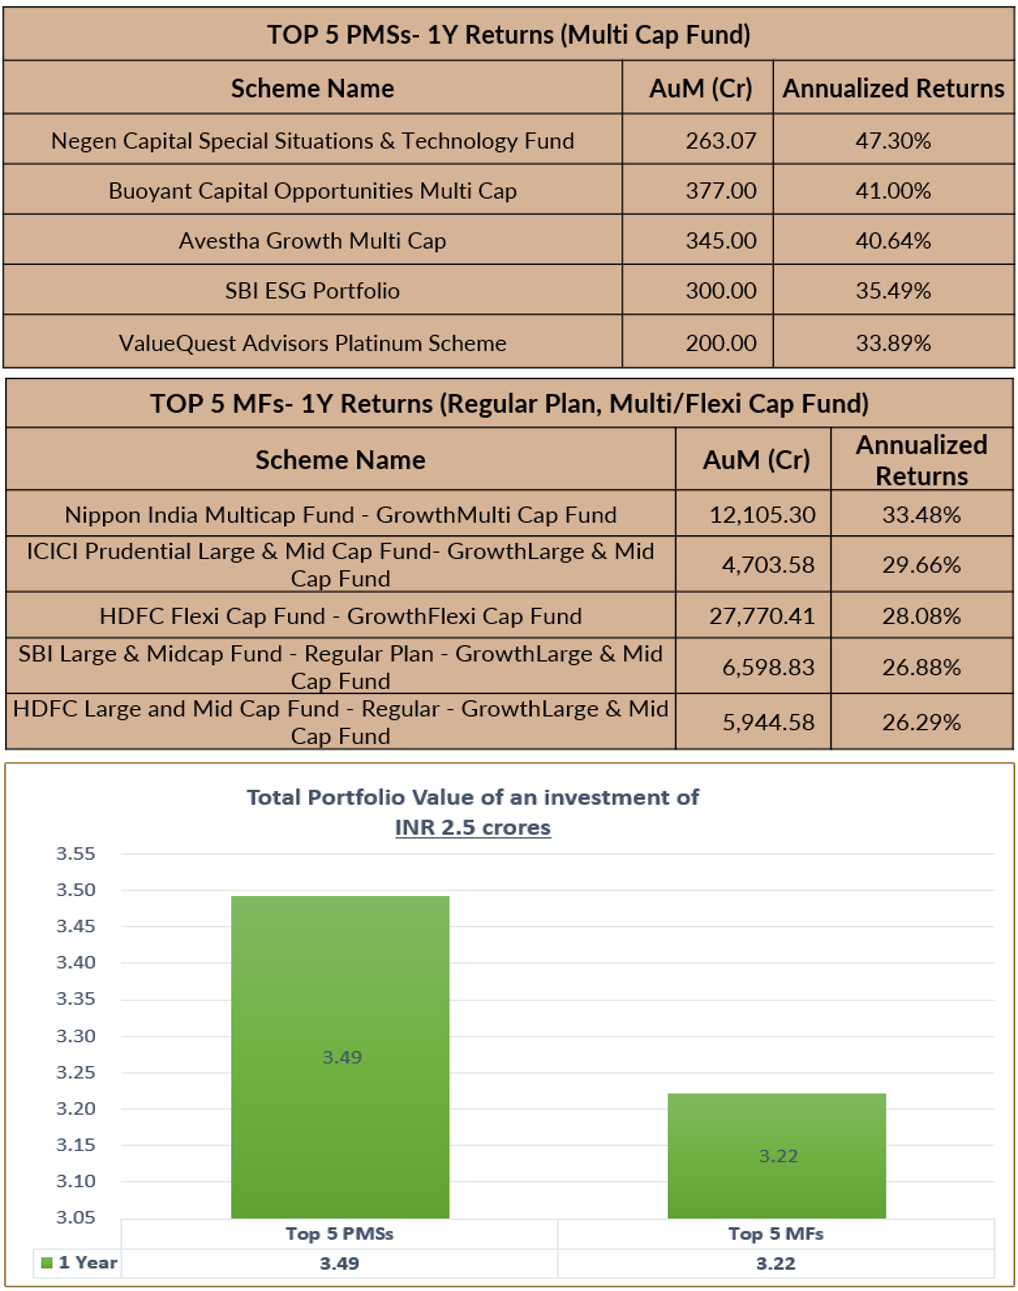 Conclusion: If one had invested Rs 2.5 Crs in these top 5 Multi Cap PMSs on 1st May 2021, rather than in the top 5 MFs, over a period of 1 year, one would have generated Rs 0.27 Cr more.
1Y Returns Comparison – Mid & Small Cap
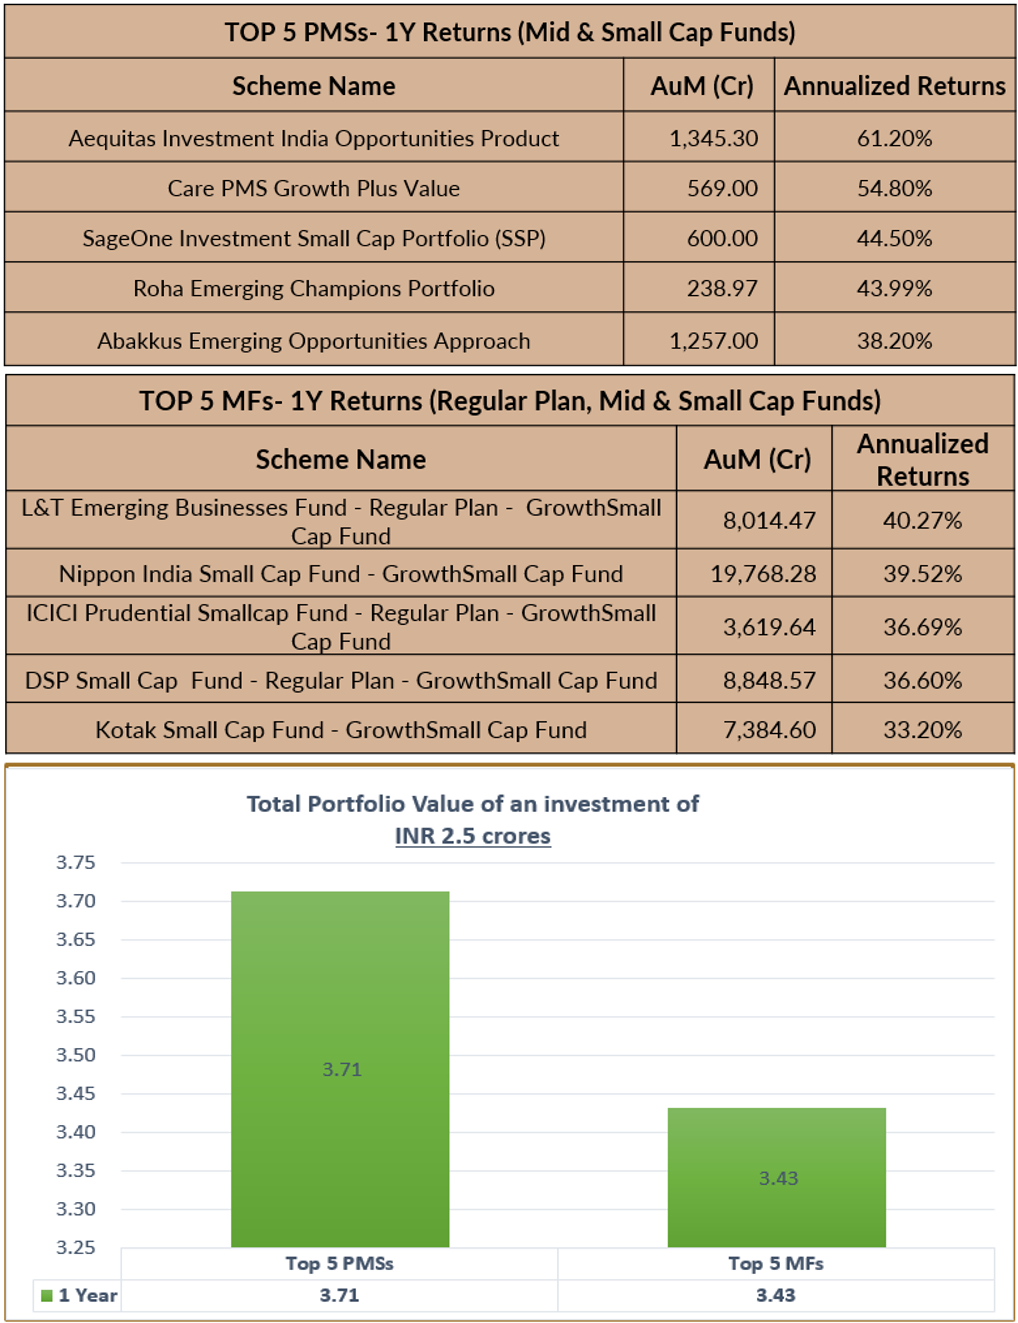 Conclusion: If one had invested Rs 2.5 Crs in these top 5 Mid & Small Cap PMSs on 1st May 2021, rather than in the top 5 MFs, over a period of 5 years, one would have generated Rs 0.28 Cr more.
From the above results, it is clear that investing in PMSs has created more wealth for investors than investing in MFs.
This was simple. The difficult task starts from here on. And, that is –
- How to select the potential Best 5 Portfoliosfor different periods of 3 to 5 years of future investments?
- How to have the conviction to hold the best ones for the longer term?
And, this is best endeavored by our Analytics & Content backed approach.
Our proprietary analysis & proprietary content helps tackle the above 2 tasks. We are very selective, and we analyze PMS products across the 5 Ps – People, Philosophy, Performance, Portfolio, and Price with an aim to ascertain the Quality, Risk, and Consistency (QRC) attributes before suggesting the same to investors.
Holding on to the good equity investments requires high conviction in the portfolio at all points of time, else, one tends to exit early owing to the traps of emotions or impatience. With our proprietary content via fund manager videos, newsletters, and articles, we keep our clients updated, and this ensures our clients always make informed decisions.
We offer responsible, long-term quality investing. Our Philosophy is simple, but not easy –
Quality + High Conviction = Compounding.
For any queries related to your investment needs, book an appointment with our experts.
This analytics is an endeavor to compare MF and PMS objectively.
Source: Moneycontrol for MF Data and respective PMS Companies’ Audited Factsheets for PMS Data. The PMS returns are TWRR Returns.
Returns more than 1 year are CAGR returns.
These are Point-to-Point returns till 30th April 2022. So, for 10Y, the period taken is 01st May 2012 to 30th April 2022 and likewise for others as well.
RISK DISCLAIMER: Investments are subject to market-related risks. This write up is meant for general information purposes and not to be construed as any recommendation or advice. The investor must make their own analysis and decision depending upon risk appetite. Only those investors who have an aptitude and attitude to risk should consider the space of Alternates (PMS & AIFs). Past Performance may or may not be sustained in the future and should not be used as a basis for comparison with other investments. Please read the disclosure documents carefully before investing. PMS & AIF products are market-linked and do not offer any guaranteed/assured returns. These are riskier investments, with a risk to principal amount as well. Thus, investors must make informed decisions. It is necessary to deep dive not only into the performance, but also into people, philosophy, portfolio, and price, before investing. We, at PMS AIF WORLD do such a detailed 5 P analysis.
Wish to make INFORMED INVESTMENTS for Long Term WEALTH CREATION

