

How Portfolio Management Services (PMS) Fee Structure Works in India
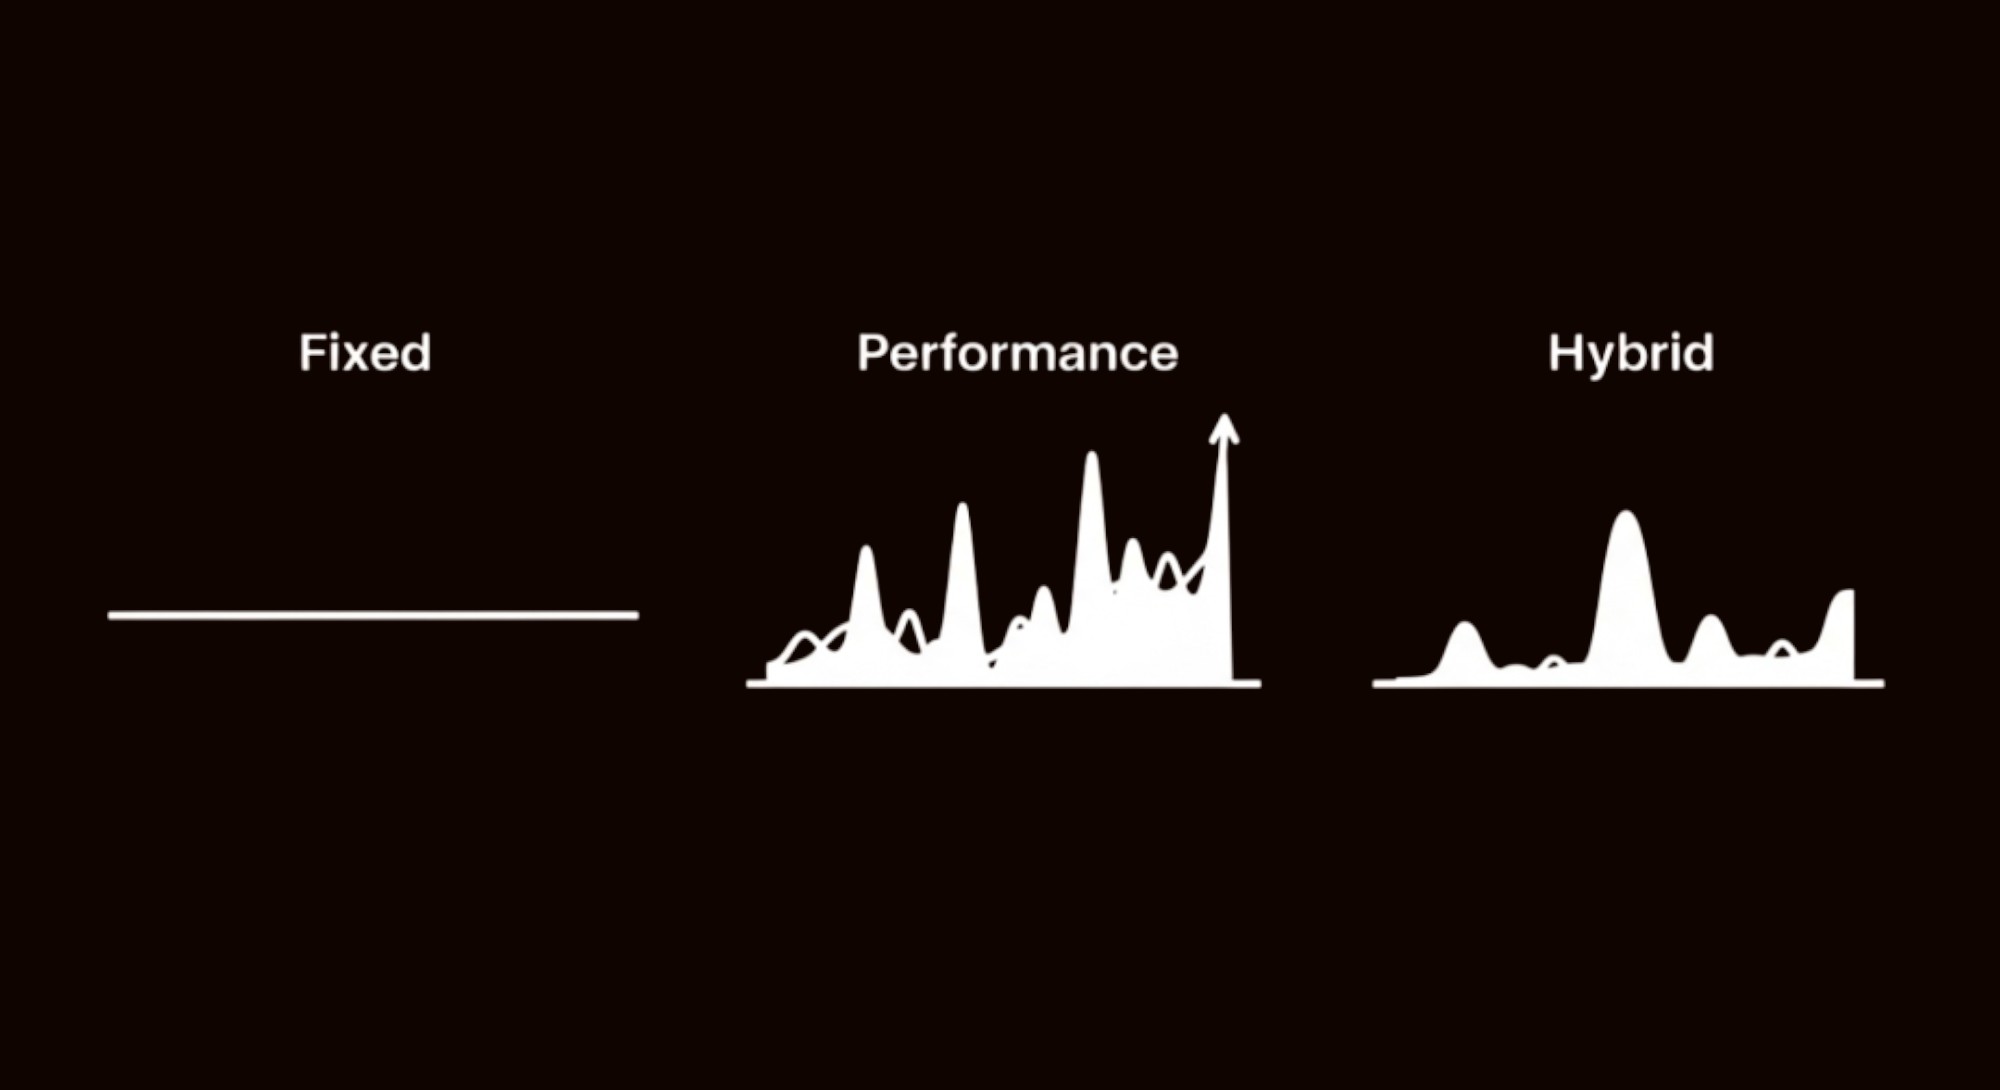
Understanding how PMS providers charge fees is essential for making an informed investment decision. Broadly, PMS fee models fall into three categories: Fixed, Performance-based, and Hybrid. Each comes with its own advantages, trade-offs, and long-term impact on investor returns.
1. Fixed Fee Model in PMS Fee Structure
What It Is
A fixed percentage charged annually on your portfolio’s average assets under management (AUM), regardless of performance.
Typical Range
Between 1.5 % to 2.5% per annum, usually billed quarterly or monthly.
Ideal For
Investors who prefer predictable, stable costs and want to avoid variable charges linked to returns.
Pros & Cons
Pros: Simple and transparent
Cons: No alignment between fees and performance — you pay even if the portfolio underperforms
Example 1: Fixed-Only Fee Model in PMS Fee Structure
| Scenario | In Case of Profit | No Profit / No Loss | In Case of Loss |
| Investment amount | ₹1,00,00,000 | ₹1,00,00,000 | ₹1,00,00,000 |
| Return on portfolio | +15% | 0% | –10% |
| Profit / Loss | ₹15,00,000 | ₹0 | –₹10,00,000 |
| Portfolio value at year-end | ₹1,15,00,000 | ₹1,00,00,000 | ₹90,00,000 |
| Average portfolio value | ₹1,07,50,000 | ₹1,00,00,000 | ₹95,00,000 |
| Fixed Fee (1.5%) | ₹1,61,250 | ₹1,50,000 | ₹1,42,500 |
| Net Portfolio Value (post fee) | ₹1,13,38,750 | ₹98,50,000 | ₹88,57,500 |
| Net Investor Return | 13.4% | –1.5% | –11.4% |
Even in a down year, a fixed fee is charged—good for predictable cost, but may hurt in negative years.
2. Performance-Based Fee Model in PMS Fee Structure
What It Is
Charges are applied only when the PMS delivers returns above a pre-agreed hurdle rate (e.g., 8–12% p.a.).
Fee Structure
You pay a share of the profits exceeding the hurdle, typically 10–20%, calculated using the high-water mark principle (i.e., no double-charging on already-earned returns).
Ideal For
Investors who want to pay only when they gain, rewarding the manager for superior performance.
Pros & Cons
Pros: Aligns the interests of the manager and investor
Cons: Can become expensive in high-return years; fee calculations are more complex
Example 2: Performance-Only Fee Model in PMS Fee Structure
(With Hurdle Rate: 10%, Performance Fee: 20% of profits above hurdle)
| Scenario | In Case of Profit | No Profit / No Loss | In Case of Loss |
| Investment amount | ₹75,00,000 | ₹75,00,000 | ₹75,00,000 |
| Return on portfolio | +18% | 0% | –12% |
| Profit / Loss | ₹13,50,000 | ₹0 | –₹9,00,000 |
| Hurdle (10%) | ₹7,50,000 | ₹7,50,000 | ₹7,50,000 |
| Profit above hurdle | ₹6,00,000 | NA | NA |
| Performance Fee (20% of excess) | ₹1,20,000 | ₹0 | ₹0 |
| Net Value after fee | ₹87,30,000 | ₹75,00,000 | ₹66,00,000 |
| Net Return to Investor | 16.4% | 0.0% | –12.0% |
You only pay when your portfolio performs—but the fee can be high in great years.
3. Hybrid Fee Model in PMS Fee Structure
What It Is
A combination of fixed fee (lower than pure fixed model) and performance fee above a hurdle rate.
Typical Breakdown
For example: 1% fixed fee + 15% of profits above 10% annual return
Ideal For
Investors are looking for a balance of cost stability and performance alignment.
Pros & Cons
Pros: Diversified fee model reduces risk
Cons: Could be costlier than fixed-only in flat markets
Example 3: Hybrid Fee Model in PMS Fee Structure
(Fixed Fee: 1%, Performance Fee: 15%, Hurdle: 12%)
| Scenario | In Case of Profit | No Profit / No Loss | In Case of Loss |
| Investment amount | ₹2,00,00,000 | ₹2,00,00,000 | ₹2,00,00,000 |
| Return on portfolio | +20% | 0% | –15% |
| Portfolio value at year-end | ₹2,40,00,000 | ₹2,00,00,000 | ₹1,70,00,000 |
| Average portfolio value | ₹2,20,00,000 | ₹2,00,00,000 | ₹1,85,00,000 |
| Fixed Fee (1%) | ₹2,20,000 | ₹2,00,000 | ₹1,85,000 |
| Hurdle (12% of ₹2 Cr) | ₹24,00,000 | ₹24,00,000 | ₹24,00,000 |
| Profit above hurdle | ₹16,00,000 | NA | NA |
| Performance Fee (15% of excess) | ₹2,40,000 | ₹0 | ₹0 |
| Total Fee Paid | ₹4,60,000 | ₹2,00,000 | ₹1,85,000 |
| Net Value After Fees | ₹2,35,40,000 | ₹1,98,00,000 | ₹1,68,15,000 |
| Net Return to Investor | 17.7% | –1.0% | –15.9% |
Hybrid offers a middle path — lower fixed fee than standalone, while also rewarding the manager in strong years.
4. Other Charges in PMS Fee Structure
Entry Load
No longer permitted by SEBI.
Exit Load
Charged for early redemption (usually within 1–3 years), typically 1–3%.
Operating Expenses
Includes audit, custodian, demat charges — often capped to maintain transparency.
Brokerage & Transaction Fees
Billed based on actual trading activity, typically 0.1–0.5% per trade.
GST
18% Goods & Services Tax is applied on both fixed and performance fees.
5. Key PMS Fee Structure Terms to Understand
- Hurdle Rate: The minimum annual return the PMS must earn before it can charge performance fees.
- High-Water Mark: Ensures performance fees are not charged twice on the same gains.
- Catch-Up: A clause that allows the PMS to earn full performance fees once the hurdle is met.
Choosing the Right Model for You
| Investor Goal | Best Fee Model | Why It Works |
| Cost Predictability | Fixed Fee | Stable fees regardless of returns |
| Pay-Per-Performance | Performance-Only | Charges apply only on excess profits |
| Balanced Cost & Incentives | Hybrid | Mix of certainty and upside sharing |
At PMS AIF WORLD, we help investors make informed and confident decisions by offering transparent, data-backed guidance on Portfolio Management Services (PMS) and Alternative Investment Funds (AIFs). Our approach goes beyond product selection—we deeply evaluate each strategy’s fee structure, consistency, risk-adjusted returns, and alignment with investor goals. Whether you’re weighing a fixed fee versus a performance-linked model or assessing long-term cost impact, we provide unbiased comparisons and personalized recommendations to ensure your capital is managed efficiently. With access to India’s top-performing managers and proprietary analytics, PMS AIF WORLD simplifies complexity—so you can invest wisely.
Disclaimer: Securities investments are subject to market risks and there is no assurance or guarantee that the objective of the investments will be achieved. The statements contained herein may include statements of future expectations and other forward-looking statements that are based on our current views and assumptions and involve known and unknown risks and uncertainties that could cause actual results, performance or events to differ materially from those expressed or implied in such statements
Do Not Simply Invest, Make Informed Decisions
WISH TO MAKE INFORMED INVESTMENTS FOR LONG TERM WEALTH CREATION

