


| Alpha (1Y) | Beta (1Y) | Standard Deviation (1Y) | % of +ve Months (SI) |
|---|
360 ONE ASSET Phoenix PMS
Key People

Mr. Anup Maheshwari
CIO, Joint – CEO
Investment Objective
IIFL Phoenix Portfolio intends to create a portfolio of such businesses with an established track record, which have the potential to see a sharp improvement in fundamentals in the future.
Investment Strategy
IIFL Phoenix Portfolio intends to create a portfolio of such businesses with an established track record, which have the potential to see a sharp improvement in fundamentals in the future.
Investment Philosophy
The investment strategy of IIFL Phoenix PMS is to invest in a portfolio following the SCDV framework (Secular, Cyclical, Defensives, Value Trap) wherein it invests in businesses having long-term track record where profitability and growth have been impacted by short term cycles.
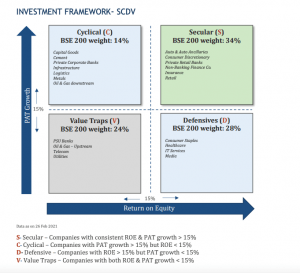
Businesses usually may witness cycles of disruption or downturns due to many factors. Firms counter-act to these downturns to stabilize business by acting on suitable strategic, organizational, operational or financial changes. The investment manager would target such opportunities having long-term mean reversion capability, having potential for sharp improvement in fundamentals. Portfolio construction shall have higher proportion in the three quadrants, Cyclical, Defensive and Value Trap where portfolio securities may have the trajectory of PAT and ROE growth to move to Secular quadrant.
Performance Table #
| Trailing Returns (%) | 1m return | 3m return | 6m return | 1y return | 2y return | 3y return | 5y return | 10y return | Since inception return |
|---|---|---|---|---|---|---|---|---|---|
QRC Report Card *
| Strategy | Category | Fund Manager | Date of Inception | Age Of PMS | Corpus (in Cr, approx) | Benchmark | Returns SI (CAGR) | Stocks In Portfolio | Sectors In Portfolio |
|---|---|---|---|---|---|---|---|---|---|
| 360 ONE Asset Management Phoenix PMS | Multi Cap & Flexi Cap | Mr. Nishant Vass | 01 January 2021 | 5Y 5M | S&P BSE 500 TRI | 11 |
| Portfolio Quality (Q) | Portfolio Risk (R) | Portfolio Consistency (C) | ||||||||
|---|---|---|---|---|---|---|---|---|---|---|
| Index | Category Alpha (1Y) | Relative Alpha (1Y) |
% of +ve Months
(Fund Data) |
Alpha (1Y) | Beta (1Y) |
Standard Deviation (1Y)
(Fund Data) |
Sharpe Ratio (1Y)
(Fund Data) |
Alpha (SI) | Information Ratio (SI) | Consistency Ratio % |
| Nifty 50 | 1.40% | 2.83% | 66.67% | 4.23% | 0.98 | 15.09% | -0.30 | 5.36% | 0.71 | 68.25 % |
| Nifty 500 | 0.44% | 2.54% | 2.98% | 0.93 | 3.13% | 0.51 | 61.90 % | |||
| Nifty Midcap 100 | -6.60% | 1.92% | -4.68% | 0.85 | -4.64% | -0.62 | 46.03 % | |||
| Nifty Smallcap 100 | 2.89% | 1.83% | 4.72% | 0.63 | -0.26% | -0.02 | 46.03 % | |||
| BSE 500 | 0.79% | 2.55% | 3.34% | 0.93 | 3.44% | 0.56 | 60.32 % | |||
VIEW DETAILED QUALITY, RISK, CONSISTENCY ANALYSIS
Do Not Simply Invest, Make Informed Decisions
WISH TO MAKE INFORMED INVESTMENTS FOR LONG TERM WEALTH CREATION
From the Founders & Managers of PMS
Which is the best company through which an investor can invest in 360 ONE ASSET Phoenix PMS?
We recommend PMS AIF WORLD, because, it is one unique platform that offers real knowledge driven investing with their highly meaningful data, reports, and content that is written very well. PMS AIF World is a team of highly articulate, educated, and experienced people.
Disclaimer
#Returns as of 30th April 2026. Returns up to 1 Year are absolute, above 1 Year are CAGR.
*QRC Report Card data is updated quarterly. Current data is as of Mar 26.

