
MOTILAL OSWAL Next Trillion Dollar Opportunity (NTDOP)
A refreshing come back in 2020. Keep the faith, Quality eventually outperforms. Expect a return back to the golden days.
MOTILAL OSWAL Next Trillion-Dollar Opportunity (NTDOP) is a 13-year-old, one of the largest and well known Multicap PMSs by size. It’s the flagship portfolio of Motilal Oswal AMC, which has created massive long-term wealth by identifying many multi-baggers from time to time, like Eicher, Page, Bajaj Finance, etc.
PEOPLE : Portfolio Manager, Management, Team
Raamdeo Agrawal, Chairman, MOAMC
Investment Mentor
- Raamdeo Agrawal is the Co-Founder of Motilal Oswal Financial Services Limited (MOFSL).
- As Chairman of Motilal Oswal Asset Management Company, he has been instrumental in evolving the investment management philosophy and framework.
- He is on the National Committee on Capital Markets of the Confederation of Indian Industry (CII), and is the recipient of “Rashtriya Samman Patra” awarded by the Government of India.
- He has also featured on ‘Wizards of Dalal Street’ on CNBC. Research and stock picking are his passions which are reflected in the book “Corporate Numbers Game” that he co-authored in 1986 along with Ram K Piparia.
- He has also authored the Art of Wealth Creation, which compiles insights from 21 years of his Annual ‘Wealth Creation Studies’.
- Raamdeo Agrawal is an Associate of the Institute of Chartered Accountants of India.
Manish Sonthalia, Fund Manager

Portfolio Manager
- Manish has been managing the Strategy since inception and also serves as the Director of the Motilal Oswal India Fund, Mauritius.
- He has over 25 years of experience in equity research and fund management, with over 14 years with Motilal Oswal PMS.
- He has been the guiding pillar in the PMS investment process and has been managing various PMS strategies and AIFs at MOAMC.
- Manish holds various post-graduate degrees including an MBA in Finance, FCA, Company Secretaryship (CS) and Cost & Works Accountancy (CWA).
PHILOSOPHY : QGLP (Quality, Growth, Longevity, Price)
Continue the legacy of identifying multi-baggers within the QGLP framework. Pioneers of Quality Investing – Powered by application of new learnings.
Quality
Growth
Longevity
Price
QGLP which is the core investment framework followed by Motilal Oswal, has evolved over time, with new learning leading to following refinements to add to the discipline over discretion.
- Trimming portfolio winners at regular intervals, if price targets run ahead of timelines.
- Maximum buying price to be diligently employed.
- Maintain active targets of profits and prices on stocks with 1 to 3 years view. Stringent due diligence and prompt action on laggards with a greater role of the investment committee.
- Mismatch of price and timelines to lead to action on both sides – selling and buying.
- Revised selling criterion to include the relative underperformance in the sector, and material fall in stock price
- Regular addition in positions if profits are inline/ahead of times and stock prices not responding.
PERFORMANCE : Returns Over Benchmark
NTDOP started in Dec 2007, probably the most unfortunate timing and despite that, it showed stellar performance over the last decade. It delivered a CAGR of 25%, from June 2009 to June 2018. Followed by this massive performance for 9 years with no single year of negative returns, it witnessed 2 bad years of under-performance (2018, 2019), owing to broader markets seeing a worse correction in these 2 years as the market skewed heavily in favor of large caps. Going by pattern of past performance, NTDOP’s theme and portfolio construct allow for a big bounce-back during periods of growth rebound (example: 27% outperformance over benchmark in FY 2010-11 after a fall of 2008-09, 79% outperformance over benchmark in FY 2015-16. Let us wait and watch how NTDOP will behave post-Covid crises, going by the recent & early signs, since July 2020, NTDOP shows a refreshing come back.
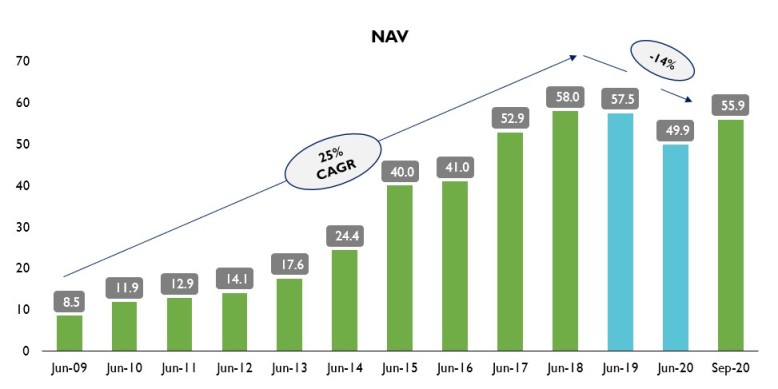
9 Yrs (up to Jun-18) delivered a 25% CAGR, followed by 2 yrs of drawdown. Not a single year of annual NAV drawdown from June 2008 to June 2018.
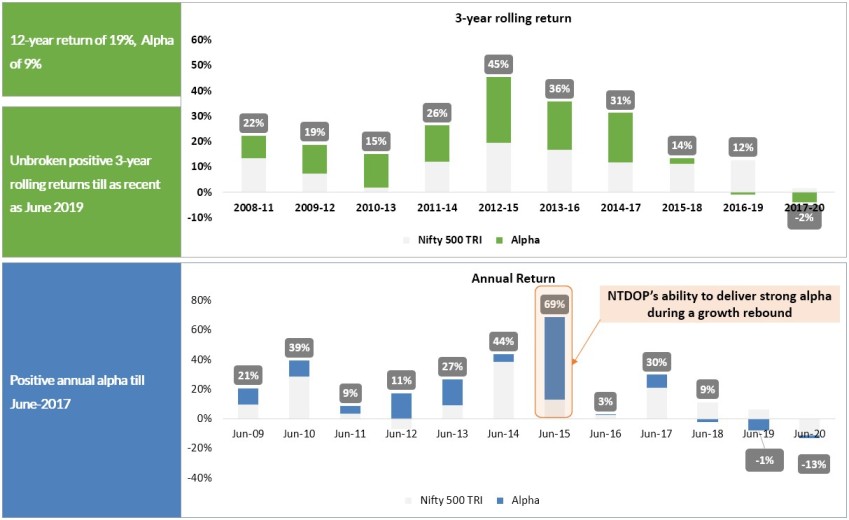
Robust returns with significant outperformance. Same manager since inception.
PORTFOLIO : Stocks / Sectors / Market Cap Allocation
NTDOP is a well-diversified portfolio of 25-26 companies across 12-14 sectors and high conviction weights across the top 10 holdings. It is positioned to benefit from the impending economic recovery. Motilal Oswal AMC / Portfolio Management Team expects a return of the golden days on the back of strong earnings growth. Following mentioned is the portfolio’s expected earnings growth for FY 22 : –
- 32% of the portfolio is slated to see PAT growth higher than 40% in FY 22
- 22% of the portfolio is expected to see PAT growth between 10% and 20% in FY 22
- 46% of the portfolio is slated to see PAT growth between 20% and 40% in FY 22
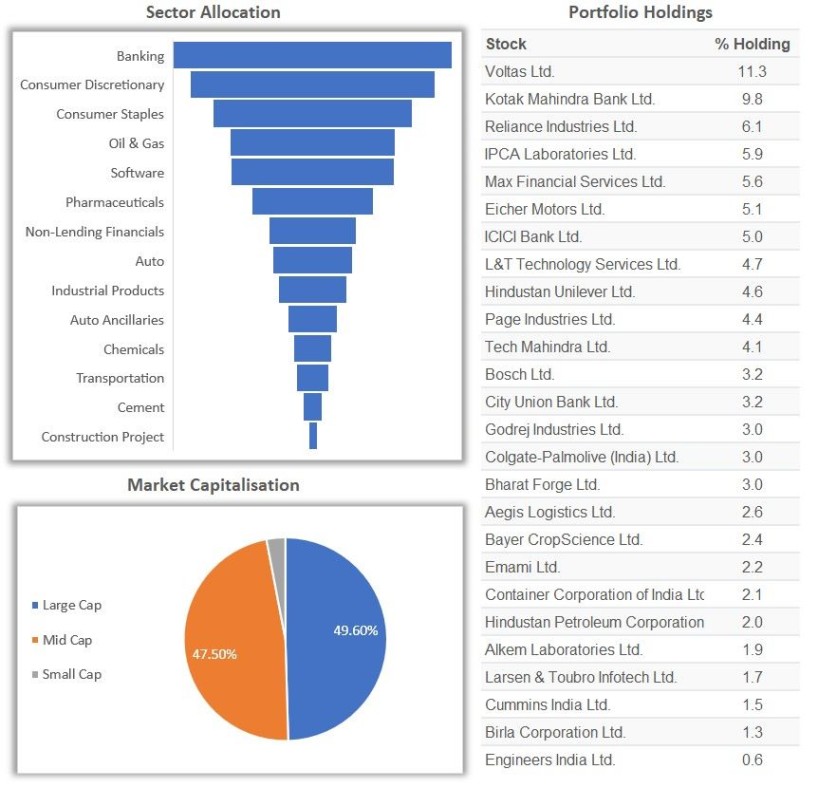
Recent new additions in the portfolio are 1) Reliance Industries, 2) Hindustan Unilever, 3) L&T infotech, 4) Birla Corporation, and recent exits from the portfolio are 1) Bajaj Finance, 2) Federal Bank, 3) J&K Bank.
NOTE: Data as of 30th September 2020
PRICE : Fixed and Variable Fee Options
Fixed Fee Option
- Management Fee: 2.5% p. a.
- Exit Load: 2% within 12 months of investment
- Other Operating Expenses: Custody Fee, Brokerage, Audit Fee Etc. ( Capped at 0.5% p. a )
Variable Fee Option
- Management Fee: 1.5% p. a
- Hurdle: 10% p. a
- Performance Fee: 15% with high watermark
- Exit Load: 2% within 12 months of investment
- Other Operating Expenses: Custody Fee, Brokerage, Audit Fee Etc ( Capped at 0.5% p. a )
The fee mentioned covers only Management fees, there are other operational fee components as well like custody fee, brokerage on sale/purchase, audit fee, etc. Do check detailed fees at the time of investment.
QRC : Quality, Risk, Consistency
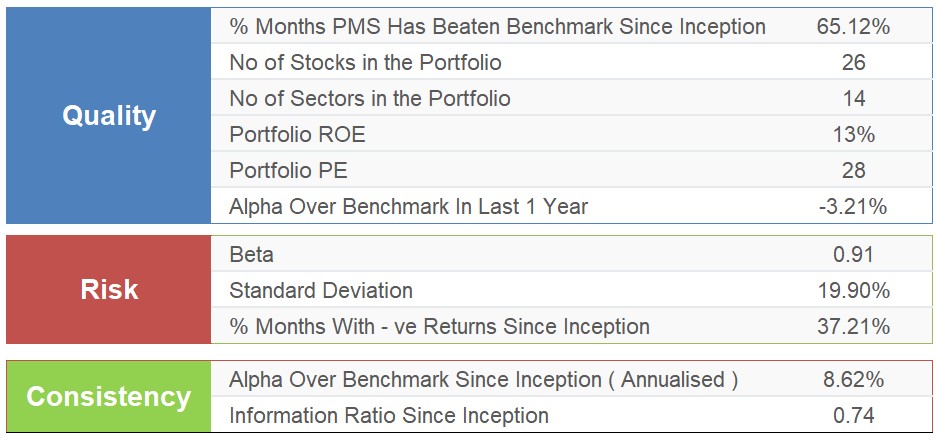
NOTE: ROE and PE are on the trailing earning numbers till 30th June. Other Data points are as of 30th Sep 2020. QRC Score generated with Nifty 500 used as the benchmark, and NAV Data from Jan 2010 to Sep 2020.
We at PMS AIF WORLD work with investors not just to make them invest, but associate to make informed investment decisions towards long term wealth creation and prosperity of our clients.
Wish to make INFORMED INVESTMENTS for Long Term WEALTH CREATION

