

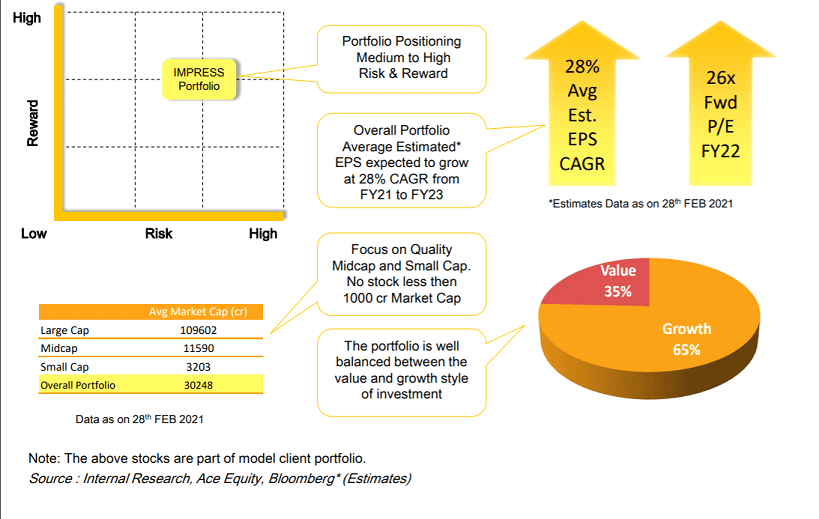
Focus on Return Optimisation by investing in multi cap portfolio of rising enterprises with sound corporate track record and sustainable business model keeping balance between value and growth strategy.
| Alpha (1Y) | Beta (1Y) | Standard Deviation (1Y) | % of +ve Months (SI) |
|---|---|---|---|
| -5.89% | 1.09 | 23.52% | 61.68% |
Investment Process
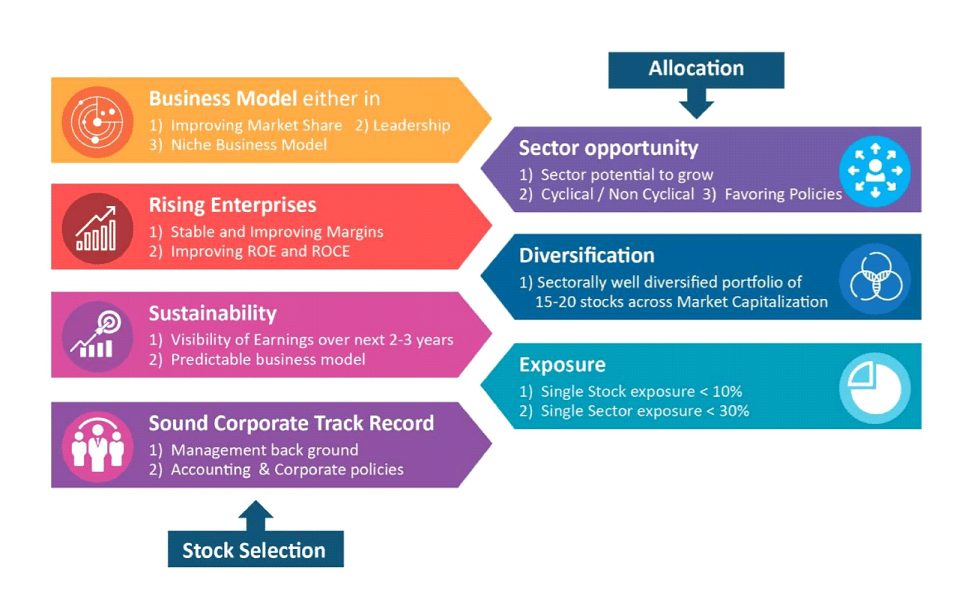
Portfolio Strategy
- Multicap aggressive concentrated portfolio of 15 – 20 stocks with 70%+ into mid and small-cap. Sectorally well-diversified portfolio. Focus is more on growth strategy with companies with better margins, return ratio, corporate governance, and earnings visibility.
Performance Table #
| Trailing Returns (%) | 1m return | 3m return | 6m return | 1y return | 2y return | 3y return | 5y return | 10y return | Since inception return |
|---|---|---|---|---|---|---|---|---|---|
| Anand Rathi Advisors Ltd Impress PMS | -11.02% | - | -15.32% | -11.50% | 3.49% | 14.27% | 15.07% | - | 11.44% |
| S&P BSE 500 TRI | -11.37% | - | -9.62% | -3.12% | 1.32% | 12.89% | 11.75% | - | 12.01% |
QRC Report Card *
| Strategy | Category | Fund Manager | Date of Inception | Age Of PMS | Corpus (in Cr, approx) | Benchmark | Returns SI (CAGR) | Stocks In Portfolio | Sectors In Portfolio |
|---|---|---|---|---|---|---|---|---|---|
| Anand Rathi Advisors Ltd Impress PMS | Multi Cap & Flexi Cap | Mr.Mayur Shah | 31 May 2017 | 8Y 10M | - | S&P BSE 500 TRI | 11.44% | 17 | 14 |
| Portfolio Quality (Q) | Portfolio Risk (R) | Portfolio Consistency (C) | ||||||||
|---|---|---|---|---|---|---|---|---|---|---|
| Index | Category Alpha (1Y) | Relative Alpha (1Y) |
% of +ve Months
(Fund Data) |
Alpha (1Y) | Beta (1Y) |
Standard Deviation (1Y)
(Fund Data) |
Sharpe Ratio (1Y)
(Fund Data) |
Alpha (SI) | Information Ratio (SI) | Consistency Ratio % |
| Nifty 50 | 0.80% | -7.18% | 61.68% | -6.38% | 1.12 | 23.52% | -0.64 | 1.59% | 0.12 | 50.47 % |
| Nifty 500 | -0.10% | -7.53% | -7.63% | 1.21 | 0.88% | 0.08 | 48.60 % | |||
| Nifty Midcap 100 | -7.10% | -8.18% | -15.28% | 1.18 | -1.92% | -0.19 | 49.53 % | |||
| Nifty Smallcap 100 | 2.38% | -8.27% | -5.89% | 1.09 | 2.73% | 0.23 | 50.47 % | |||
| BSE 500 | 0.25% | -7.52% | -7.27% | 1.21 | 0.98% | 0.08 | 50.47 % | |||
VIEW DETAILED QUALITY, RISK, CONSISTENCY ANALYSIS
Portfolio Holdings
| Holding | % |
|---|---|
| Schneider Electric Infrastructure Limited | 7.93 |
| Bharat Electronics Ltd | 7.49 |
| KEI Industries Ltd | 7.03 |
| APL Apollo Tubes Limited | 6.74 |
| Lumax Auto Technologies Limited | 6.34 |
| Cholamandalam Investment & Finance Company Ltd | 6.19 |
| Radico Khaitan Ltd | 6.17 |
| LT Foods Limited | 5.90 |
| PNB Housing Finance Limited | 5.69 |
| Cemindia Projects Limited | 5.43 |
Sector Allocation
| Holding | % |
|---|---|
| Consumables | 12.25 |
| Power | 12.30 |
| Infrastructure | 9.10 |
| Defence | 7.50 |
| IT | 6.32 |
| Healthcare | 8.90 |
| Consumer Durables | 5.40 |
| Capital Goods | 7.90 |
| Railways | 5.55 |
| Iron & Steel | 6.70 |
| Financials | 11.90 |
| Consumer Discretionary | 9.80 |
| Automobile & Ancillaries | 6.30 |
| FMCG | 5.90 |
Market Cap Allocation
| Allocations | % |
|---|---|
| Large Cap | 17.30 |
| Mid Cap | 28.80 |
| Small Cap | 50.80 |
| Cash | 3.00 |
Do Not Simply Invest, Make Informed Decisions
WISH TO MAKE INFORMED INVESTMENTS FOR LONG TERM WEALTH CREATION
Disclaimer
#Returns as of 31st March 2026. Returns up to 1 Year are absolute, above 1 Year are CAGR.
*QRC Report Card data is updated quarterly. Current data is as of Mar 26.

